Полная версия:
Economics
(c) MERGERS/TAKEOVERS. The Commission can investigate mergers involving companies with a combined world-wide turnover of over €5 billion (£3.7 bn) if the aggregate EU-wide turnover of the companies concerned is greater than €250 million. Again, the main aim is to prevent mergers likely adversely to affect competition and trade within the EU.
These thresholds still apply generally, but in 1998 they were reduced to €3.5 billion and €100 million, respectively, for mergers affecting the competitive situation in three (or more) EU countries in cases where the combined turnover of the companies exceed €25 million in each of the three countries.
Generally, where EU competition laws apply, they take precedence over the national competition laws of member countries. However, a subsidiarity provision can be invoked, which permits the competition authority of a member country to request permission from the EU Competition Directorate to investigate a particular dominant firm or merger case if it appears that the ‘European dimension’ is relatively minor compared to its purely local impact.
competition policy (UK) covers six main areas of application under UK COMPETITION LAWS:
(a) MONOPOLIES/MARKET DOMINANCE. The COMPETITION ACT 1998 prohibits actions that constitute the ‘abuse’ of a dominant position in a UK market. The OFFICE OF FAIR TRADING (OFT) is responsible for the referral of selected goods and services monopolies (both private and public sectors) to the COMPETITION COMMISSION for investigation and report and the implementation (where it sees fit) of the Commission’s recommendations.
A dominant position is defined as a situation where one firm controls 40% or more of the ‘reference’ good or service. (Under previous legislation, market dominance was defined in terms of a 25% market share). Abuse consists of acts that are harmful to the interests of consumers and other suppliers, e.g. charging excessive prices to secure monopoly profits and imposing restrictive terms and conditions on the supply of goods (see EXCLUSIVE DEALING, TIE-IN SALES, etc). The term ‘abuse’ can be broadly equated with that of conduct contrary to the ‘public interest’ – the benchmark used in previous legislation.
Defining the ‘reference’ market to establish evidence of market dominance can be problematic since it raises the issue of how widely or narrowly the boundaries of ‘the market’ are to be delineated (see MARKET, MARKET CONCENTRATION). Thus, the drinks market could be divided as between alcoholic and non-alcoholic drinks, and further divided into sub-markets as between, for example, the various types of alcoholic drink – the beer/lager market, spirits market, wine market, etc. Establishing abuse can also be a ‘grey area’. For example, high prices and profits may be condoned because they reflect exceptional innovation; on the other hand, low profits may not be a sign of effective competition but reflect the fact that the firm is grossly inefficient;
(b) ANTI-COMPETITIVE AGREEMENTS/RESTRICTIVE TRADE AGREEMENTS. The Competition Act 1998 prohibits outright agreements between firms (i.e. COLLUSION) and CONCERTED PRACTICES that prevent, restrict or distort competition within the UK. The Office of Fair Trading is responsible for monitoring ‘suspected’ cases of firms operating agreements illegally and can refer them for further investigation by the Competition Commission. The prohibition applies to both formal and informal agreements, whether oral or in writing, and covers agreements that involve joint price-fixing and common terms and conditions of sale, market-sharing and coordination of capacity adjustments, etc. (Under previous legislation it was possible to obtain exemption from prohibition if it could be demonstrated that an agreement conferred ‘net economic benefit’ – see RESTRICTIVE TRADE PRACTICES ACTS, RESTRICTIVE PRACTICES COURT.)
Although anti-competitive agreements are technically illegal, nonetheless there is much evidence that many such agreements have been driven ‘underground’ and are continuing to be operated in secret. This problem has been addressed by the authorities in encouraging ‘whistleblowers’ to come forward and supply them with information about illegal activities and also provisions in the Competition Act 1998 that allow officials to enter business premises without warning and to seize incriminating documentation. Under the ENTERPRISE ACT 2002, participation in illegal agreements has now been made a criminal offence, punishable by imprisonment;
(c) MERGERS AND TAKEOVERS. Originally, under the FAIR TRADING ACT 1973, the Office of Fair Trading (OFT), acting alongside the Secretary of State for Industry, could refer mergers and takeovers to the Competition Com-mission for investigation and report where (1) the combined firms already had or would have had a market share of 25% or over in a ‘reference’ good or service; (2) the value of assets being combined exceeded £70 million. Clause (1) effectively covered horizontal mergers and takeovers (see HORIZONTAL INTEGRATION) and clause (2) vertical and conglomerate mergers and takeovers (see VERTICAL INTEGRATION, DIVERSIFICATION/CONGLOMERATE INTEGRATION). Under the ENTERPRISE ACT 2002, the OFT was given sole responsibility for merger/takeover references but subject to an appeals procedure in disputed cases (see COMPETITION APPEALS TRIBUNAL).
Mergers and takeovers nowadays are mainly evaluated in terms of their likely competitive effects. Unlike in dealing with established monopolies, where past conduct can be scrutinised to establish harmful effects, mergers and takeovers are about the future, and predicting the likely future effects of a merger/takeover is problematic. Faced with this difficulty, the Commission tends to ‘play safe’ and recommend the blocking of most mergers/takeovers that reduce competition by significantly increasing the level of MARKET CONCENTRATION;
(d) RESALE PRICE MAINTENANCE (RPM). Manufacturers’ stipulation of the resale prices of their products is generally prohibited in the UK, although under the RESALE PRICES ACTS it is possible for a manufacturer to obtain exemption by satisfying the Competition Commission that, on balance, RPM confers net economic benefit. The OFT is responsible for monitoring manufacturers’ policies towards retail prices and can take action against ‘suspected’ cases of manufacturers attempting (illegally) to enforce RPM. Manufacturers can, however, take action against retailers who use their products as LOSS LEADERS;
(e) ANTI-COMPETITIVE PRACTICES. Various trade practices, such as EXCLUSIVE DEALING, REFUSAL TO SUPPLY, FULL-LINE FORCING, etc., may be investigated both by the OFT itself and (if necessary) by the Competition Commission, and prohibited if they are found to be unduly restrictive of competition;
(f) CONSUMER PROTECTION. The OFT is also charged with protecting consumers’ interests generally, both by taking action against unscrupulous trade practices, such as false descriptions of goods and weights and measures, denial of proper rights of guarantee to cover defective goods, etc., and by encouraging groups of suppliers to draw up voluntary codes of ‘good’ practice.
Where a particular dominant firm or merger case falls within the competition rules of both the UK and the European Union (see COMPETITION POLICY (EU)), EU law takes precedence. However, a subsidiarity provision can be invoked that permits the OFT to request permission from the EU competition authorities to investigate a particular dominant firm or merger case if it appears that the ‘European dimension’ is relatively minor compared to its purely local impact.
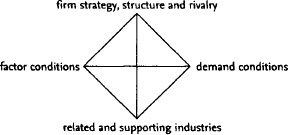
Fig. 26 Competitive advantage (of countries). The Porter ‘diamond’.
competitive advantage (of countries) the resources and capabilities possessed by a country that underpin its competitiveness in international trade (see COMPARATIVE ADVANTAGE). Countries per se do not trade – only persons and firms do. Persons and firms may possess their own unique resources and capabilities, which give them a competitive advantage over others. See COMPETITIVE ADVANTAGE (OF FIRMS). This can be enhanced by firms being able to contribute, and tap in, to a country’s resources and capabilities. Michael Porter has developed the so-called ‘diamond’ framework, which encapsulates this potential, consisting of four elements: factor endowments, demand conditions, infrastructure and firm strategy/structure/rivalry. See Fig. 26.
A basic starting point is a country’s factor endowments, such as plentiful (i.e. cheap) labour or skilled labour, raw materials and capital stock, together with its underlying scientific and technological infrastructure. With regard to demand conditions, it is not so much the size of the home market (although it is accepted that a large home base may be necessary to underpin economies of scale in lowering supply costs and prices) as its nature that matters. Porter emphasizes the importance of the presence of sophisticated and demanding buyers in stimulating the innovation and introduction of new products capable of being ‘transferred’ into global markets. The category of ‘related and supporting industries’ provides an important bedrock for competitive success through a network of suppliers and commercial infrastructure (see CLUSTERS). The final quadrant, ‘firm strategy, structure and rivalry’, Porter suggests, may be the most important of all, especially the element of fierce local competition. While international rivalries tend to be ‘analytical and distant’, local rivalries become intensively personal but nonetheless beneficial in providing a ‘springboard’ for international success. All these factors, it is suggested, are interrelated, creating a ‘virtuous circle’ of resource generation and application, and sensitivity in meeting customer demands.
competitive advantage (of firms) the possession by a firm of various assets and attributes (low-cost plants, innovative brands, ownership of raw material supplies, etc.) that give it a competitive edge over rival suppliers. To succeed against competitors in winning customers on a viable (profitable) and sustainable (long-run) basis, a firm must, depending on the nature of the market, be cost-effective and/or able to offer products that customers regard as preferable to the products offered by rival suppliers. The former enables a firm to meet and beat competitors on price, while the latter reflects the firm’s ability to establish PRODUCT DIFFERENTIATION advantage over competitors.
Cost advantages over competitors are of two major types:
(a) absolute cost advantages, that is, lower costs than competitors at all levels of output deriving from, for example, the use of superior production technology or from VERTICAL INTEGRATION of input supply and assembly operations;
(b) relative cost advantages, that is, cost advantages related to the scale of output accruing through the exploitation of ECONOMIES OF SCALE in production and marketing and through cumulative EXPERIENCE CURVE effects. Over time, investment in plant renewal, modernization and process innovation (either through in-house RESEARCH AND DEVELOPMENT or the early adoption of new technology developed elsewhere) is essential to maintain cost advantages.
Product differentiation advantages derive from:
(a) a variety of physical product properties and attributes (notably the ability to offer products that are regarded by customers as having unique qualities or as being functionally better than competitors’ products);
(b) the particular nuances and psychological images built into the firm’s product by associated advertising and sales promotion. Again, given the dynamic nature of markets, particularly product life cycle considerations, competitive advantage in this area needs to be sustained by an active programme of new product innovation and upgrading of existing lines. See COMPETITIVE STRATEGY, RESOURCE BASED THEORY OF THE FIRM, BARRIERS TO ENTRY, MOBILITY BARRIERS, VALUE-CREATED MODEL, VALUE CHAIN ANALYSIS.
competitive strategy an aspect of BUSINESS STRATEGY that involves the firm developing policies to meet and beat its competitors in supplying a particular product. This requires the firm to undertake an internal appraisal of its resources and capabilities relative to competitors to identify its particular strengths and weaknesses. It also requires the firm to undertake an external appraisal of the nature and strength of the various ‘forces driving competition’ in its chosen markets (see Fig 27), namely:
(a) rivalry amongst existing firms;
(b) bargaining power of input suppliers;
(c) bargaining power of customers;
(d) threat of new entrants; and
(e) the threat of substitute products.
The key to a successful competitive strategy is then:
(a) to understand fully what product attributes are demanded by buyers (whether it be low prices or product sophistication) with a view to;
(b) establishing, operationally, a position of COMPETITIVE ADVANTAGE that makes the firm less vulnerable to attack from established competitors and potential new entrants, and to erosion from the direction of buyers, suppliers and substitute products.
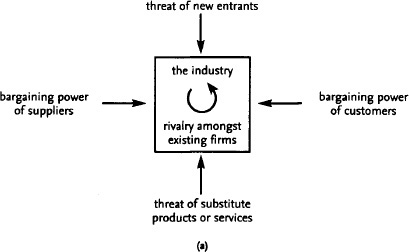
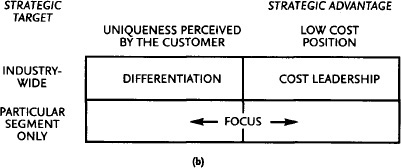
Fig. 27 Competitive strategy. (a) Forces driving competition in a market. (b) Three generic strategies. Source: Michael Porter.
There are three generic strategies for competitive success (Fig. 27 (b)): cost leadership, product differentiation and ‘focus’. Low costs, particularly in commodity-type markets, help the firm not only to survive price competition should it break out but, importantly, enable it to assume the role of market leader in establishing price levels that ensure high and stable levels of market profitability. The sources of cost-effectiveness are varied, including the exploitation of ECONOMIES OF SCALE, investment in best state-of-the-art technology and preferential access to raw materials or distribution channels. By adopting a PRODUCT DIFFERENTIATION strategy, a firm seeks to be unique in its market in a way that is valued by its potential customers. Product differentiation possibilities vary from market to market but are associated with the potential for distinguishing products by their physical properties and attributes and the experience of satisfaction – real and psychological – imparted by the product to consumers. General cost leadership and differentiation strategies seek to establish a COMPETITIVE ADVANTAGE over rival suppliers across the whole market. By contrast, ‘focus’ strategies aim to build competitive advantages in narrower segments of a market but, again, either in terms of cost or, more usually, differentiation characteristics, with ‘niche’ suppliers primarily catering for speciality product demands. See MARKET STRUCTURE, MARKET CONDUCT, MARKET PERFORMANCE, RESOURCE-BASED THEORY OF THE FIRM.
competitive tender an invitation for private sector firms to submit TENDERS (price bids) for contracts to supply goods or services to the public sector which the public sector has traditionally supplied for itself. Competitive tendering seeks to introduce competition in the provision of goods or services and thus reduce the costs to government departments, local authorities and health authorities. See DEREGULATION.
competitor a business rival of a firm supplying a good or service that offers buyers an identical or similar product. See COMPETITION, COMPETITIVE ADVANTAGE, COMPETITIVE STRATEGY, PRODUCT DIFFERENTIATION.
complementary products GOODS or SERVICES whose demands are interrelated (a joint demand) so that an increase in the price of one of the goods results in a fall in the demand for the other. For example, if the price of tennis rackets goes up, this results not only in a decrease in the demand for rackets but, because less tennis is now played, a fall also in the demand for tennis balls. See SUBSTITUTE PRODUCTS, CROSS-ELASTICITY OF DEMAND.
complete contract see CONTRACT.
complex monopoly a situation defined by UK COMPETITION POLICY as one in which two or more suppliers of a particular product restrict competition between themselves. ‘Complex monopoly’ in essence refers to an OLIGOPOLY situation where the firms concerned, although pursuing individual (i.e. non-collusive) policies, nonetheless behave in a uniform manner and produce a result that is non-competitive (i.e. similar to COLLUSION). The problem is that it is often difficult to distinguish between competitive and non-competitive situations. For example, if firms charge identical prices, is this reflective of competition (i.e. prices that are brought together because of competition) or a deliberate suppression of competition?
compound interest the INTEREST on a LOAN that is based not only on the original amount of the loan but the amount of the loan plus previous accumulated interest. This means that, over time, interest charges grow exponentially; for example, a £100 loan earning compound interest at 10% per annum would accumulate to £110 at the end of the first year and £121 at the end of the second year, etc., based on the formula: compound sum = principal (1 + interest rate) number of periods
that is, 121 = 100 (1 + 0.1)2.
Compare SIMPLE INTEREST.
computer an electronic/electromechanical device that accepts alphabetical and numerical data in a predetermined form, stores and processes this data according to instructions contained in a computer program, and presents the analysed data.
Computers have dramatically improved the productivity of data processing in commerce and business; for example, computer-aided design and computer-aided manufacturing systems have improved the speed and cost with which new components or products can be assigned and subsequently scheduled for production; computer-aided distribution and stock control systems such as ELECTRONIC POINT OF SALE (EPOS) have helped to minimize stockholdings and have improved customer services; computers have rapidly taken over the manual tasks of keeping accounting records such as company sales and payroll. Computers have also played a prominent role in speeding up the response of commodity and financial markets to changing demand and supply conditions by processing and reporting transactions quickly.
In recent years computers have underpinned the rapid expansion of E-COMMERCE using the INTERNET. See STOCK EXCHANGE, AUTOMATION, MASS PRODUCTION.
concealed unemployment see DISGUISED UNEMPLOYMENT.

concentration measures
The measures of the size distribution of firms engaged in economic activities.
The broadest concentration measure is the aggregate concentration measure, which looks at the share of total activity in an economy accounted for by the larger firms, for example, the proportion of total industrial output accounted for by the largest 200 firms; or the share of total manufacturing output produced by the 100 largest companies. Various size criteria may be used for this measure, in particular, sales, output, numbers employed and capital employed, each of which can give slightly different results because of differences in capital intensity. Such measures serve to give an overall national view of concentration and how it is changing over time.
Although aggregate concentration measures are useful, they are generally too broad for purposes of economic analysis where interest focuses upon markets and performance in these markets. Consequently, economists have developed several measures of MARKET concentration that seek to measure SELLER or BUYER CONCENTRATION. The most common of these measures is the CONCENTRATION RATIO, which records the percentage of a market’s sales accounted for by a given number of the largest firms in that market. In the UK it has been usual to estimate the concentration ratio for the three or (more recently) five largest firms, whereas in the USA the four-firm concentration ratio tends to be employed.
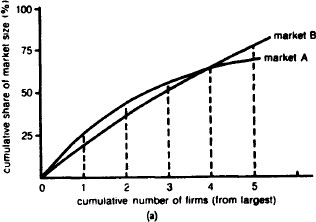
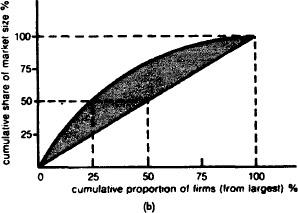
Fig. 28 Concentration measures. (a) Cumulative concentration curves, showing the cumulative share of market size accounted for by various (cumulative) numbers of firms. (b) The Lorenz curve shows the cumulative share of market size on one axis accounted for by various (cumulative) percentages of the number of firms in the market.
The concentration ratio, however, records only seller concentration at one point along the cumulative concentration curve, as Fig. 28 (a) indicates. This makes it difficult to compare concentration curves for two different markets, like A and B in the figure, where their concentration curves intersect. For example, using a three-firm concentration ratio, market A is more concentrated while using a five-firm ratio shows market B to be more concentrated. An alternative concentration index, called the HERFINDAHL INDEX, gets around this problem by taking into account the number and market shares of all firms in the market. The Herfindahl index is calculated by summing the squared market shares of all firms. The index can vary between a value of zero (where there are a large number of equally sized firms) and one (where there is just one firm).
Concentration measures, like the concentration ratio and the Herfindahl index, are known as absolute concentration measures since they are concerned with the market shares of a given (absolute) number of firms. By contrast, relative concentration measures are concerned with inequalities in the share of total firms producing for the market. Such irregularities can be recorded in the form of a Lorenz curve as in Fig. 28 (b). The diagonal straight line shows what a distribution of complete equality in firm shares would look like, so the extent to which the Lorenz curve deviates from this line gives an indication of relative seller concentration. For example, the diagonal line shows how we might expect 50% of market sales to be accounted for by 50% of the total firms, whilst in fact 50% of market sales are accounted for by the largest 25% of total firms, as the Lorenz curve indicates. The Gini coefficient provides a summary measure of the extent to which the Lorenz curve for a particular market deviates from the linear diagonal. It indicates the extent of the bow-shaped area in the figure by dividing the shaded area below the Lorenz curve by the area above the line of equality. The value of the Gini coefficient ranges from zero (complete equality) to one (complete inequality).
In practice, most market concentration studies use concentration ratios calculated from data derived from the census of production.
Concentration measures are widely used in economic analysis and for purposes of applying COMPETITION POLICY to indicate the degree of competition or monopolization present in a market. They need to be treated with caution, however. On the one hand, they may overstate the extent of monopolization. First, the boundaries of the market may be defined too narrowly (for example, the ‘beer market’) when it might be more appropriate to adopt a wider interpretation of what constitutes the relevant market by including actual and potential substitutes (for example, the ‘alcoholic drink market’, which includes also spirits and wines). Thus, calculating a firm’s market share in terms of the beer market alone may make it seem more powerful than it actually is. Secondly, concentration ratios are usually compiled by reference to the output of domestic suppliers, thus ignoring the competition afforded by imports. Thirdly, market concentration is only one element of market structure. If BARRIERS TO ENTRY to the market are relatively low, or suppliers are confronted by powerful buyers, again the market may well be much more competitive than shown by the concentration ratio. On the other hand, concentration ratios may understate the degree of monopolization. First, the market may be defined too broadly when a narrower specification of the market’s boundaries may be more appropriate. This can be important in the context of suppliers who deliberately choose to ‘focus’ on a narrow segment of the market (see COMPETITIVE STRATEGY). Secondly, conduct elements as well as structure variables need to be considered. For example, while superficially a market with a low or moderate degree of seller concentration may appear to be competitive, in practice it may be highly monopolistic because the suppliers have set up a price-fixing CARTEL.