Полная версия:
Economics
decreasing returns to the variable-factor input see DIMINISHING RETURNS.
deferred compensation payment schemes that pay lower wages during the early years of employment in an organization and higher wages in subsequent years. With deferred compensation schemes, a worker’s remuneration increases with seniority and experience, which tend to improve the worker’s efficiency within the organization. Such compensation schemes tend to reduce labour turnover and reduce SHIRKING. See PAY.
deficiency payment see INCOME SUPPORT.
deficit see BUDGET DEFICIT, BALANCE OF PAYMENTS.
deficit financing see BUDGET DEFICIT, PUBLIC SECTOR BORROWING REQUIREMENT.
deflation a reduction in the level of NATIONAL INCOME and output usually accompanied by a fall in the general price level (DISINFLATION).
A deflation is often deliberately brought about by the authorities in order to reduce INFLATION and to improve the BALANCE OF PAYMENTS by reducing import demand. Instruments of deflationary policy include fiscal measures (e.g. tax increases) and monetary measures (e.g. high interest rates). See MONETARY POLICY, FISCAL POLICY.
deflationary gap or output gap the shortfall in total spending (AGGREGATE DEMAND) at the FULL EMPLOYMENT level of national income (POTENTIAL GROSS NATIONAL PRODUCT). Because of a deficiency in spending, some of the economy’s resources lie idle and ACTUAL GROSS NATIONAL PRODUCT is below that of potential GNP. To counteract this deficiency in spending, the authorities can use FISCAL POLICY and MONETARY POLICY to expand aggregate demand. See Fig. 37. See also DEFLATION, REFLATION, INFLATIONARY GAP.
DEFRA see DEPARTMENT FOR THE ENVIRONMENT, FOOD AND RURAL AFFAIRS.
deindustrialization a sustained fall in the proportion of national output accounted for by the industrial and manufacturing sectors of the economy, a process that is often accompanied by a decline in the number of people employed in industry (compare INDUSTRIALIZATION).
There is a well-established trend in advanced economics for the industrial sector to grow more slowly than the service sector, as shown in Fig. 38. For the UK, the share of industry in GDP fell from 43% in 1960 to 29% in 2002, while the share of services increased from 54% to 70%. Over the same period, employment in industry in the UK fell from 11.8 million in 1960 to 3.7 million in 2003.
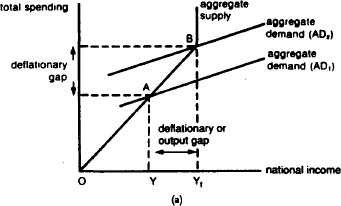
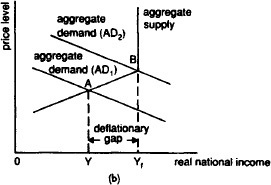
Fig. 37 Deflationary gap. (a) The AGGREGATE SUPPLY SCHEDULE is drawn as a 45-degree line because businesses will offer any particular level of output only if they expect total spending (aggregate demand) to be just sufficient to sell all of that output. However, once the economy reaches the full employment level of national income (OY1), then actual output cannot expand further and at this level of output the aggregate supply schedule becomes vertical. (b) Alternatively, aggregate supply can be depicted in terms of the various levels of real national income supplied at each price level. Again, once the economy reaches the full employment level of real national income, the aggregate supply schedule becomes vertical. In both (a) and (b), if aggregate demand is at a low level (AD1), then actual output (OY) will be determined by the intersection of AD1 and the aggregate supply schedule at point A; this output (OY) is less than potential output (OY1), leaving an output gap. An output gap can be removed by the authorities by expanding aggregate demand to the full employment level of aggregate demand (AD2) where actual output (determined by the intersection of AD2 and the aggregate supply schedule at point B) corresponds with potential GNP.
Changes in sector shares may simply reflect changes in the pattern of final demand for goods and services over time, and as such may be considered a ‘natural’ development associated with a maturing economy. On the other hand, deindustrialization that stems from supply-side deficiencies (high costs, an overvalued exchange rate, lack of investment and innovation) which put a country at a competitive disadvantage in international trade (see IMPORT PENETRATION) is a more serious matter. In this case, deindustrialization often brings with it a fall in national output, rising unemployment and balance of payments difficulties.
The extent of deindustrialization in the UK was even more marked in the early 1980s because of Britain’s artificially high exchange rate, bolstered by UK oil exports, which caused Britain to lose overseas markets. See STRUCTURE OF INDUSTRY, STRUCTURAL UNEMPLOYMENT.
Fig. 38 Deindustrialization. The distribution of gross national product shows how the industrial sector in advanced economics grows more slowly than the service sector. The figures for industry include those for manufacturing. Source: World Development Report, World Bank, 2004.
delivered pricing the charging of a PRICE for a product that includes the cost of transporting the product from the manufacturer to the customer. The delivered prices quoted by a manufacturer might accurately reflect the actual costs of transportation to different areas, or alternatively, discriminatory prices might be used to cross-subsidize areas in order to maximize sales across the country. See BASING POINT PRICE SYSTEM.
delivery note a document sent by a supplier to a customer at the time when products are supplied that itemizes the physical quantities of product supplied. Thereafter an INVOICE is usually sent to the customer showing the money value of products supplied. Compare STATEMENT OF ACCOUNT.
demand or effective demand the WANT, need or desire for a product backed by the money to purchase it. In economic analysis, demand is always based on ‘willingness and ability to pay’ for a product, not merely want or need for the product. CONSUMERS’ total demand for a product is reflected in the DEMAND CURVE. Compare SUPPLY.
demand curve a line showing the relationship between the PRICE of a PRODUCT or FACTOR OF PRODUCTION and the quantity DEMANDED per time period, as in Fig. 39.
Most demand curves slope downwards because (a) as the price of the product falls, consumers will tend to substitute this (now relatively cheaper) product for others in their purchases; (b) as the price of the product falls, this serves to increase their real income, allowing them to buy more products (see PRICE EFFECT, INCOME EFFECT, SUBSTITUTION EFFECT). In a small minority of cases, however, products can have an UPWARD-SLOPING CURVE.
The slope of the demand curve reflects the degree of responsiveness of quantity demanded to changes in the product’s price. For example, if a large reduction in price results in only a small increase in quantity demanded (as would be the case where the demand curve has a steep slope) then demand is said to be price inelastic (see PRICE-ELASTICITY OF DEMAND).
The demand curve interacts with the SUPPLY CURVE to determine the EQUILIBRIUM MARKET PRICE. See DEMAND FUNCTION, DEMAND CURVE (SHIFT IN), DIMINISHING MARGINAL UTILITY, MARGINAL REVENUE PRODUCT.
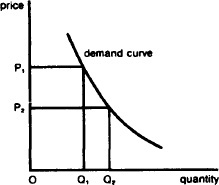
Fig. 39 Demand curve. Demand is the total quantity of a good or service that buyers are prepared to purchase at a given price. Demand is always taken to be effective demand, backed by the ability to pay, and not just based on want or need. The typical market demand curve slopes downwards from left to right, indicating that as price falls more is demanded (that is, a movement along the existing demand curve). Thus, if price falls from OP1 to OP2, the quantity demanded will increase from OQ1 to OQ2.
demand curve (shift in) a movement of the DEMAND CURVE from one position to another (either left or right) as a result of some economic change other than price. A given demand curve is always drawn on the CETERIS PARIBUS assumption that all the other factors affecting demand (income, tastes, etc.) are held constant. If any of these changes, however, then this will bring about a shift in the demand curve. For example, if income increases, the demand curve will shift to the right, so that more is now demanded at each price than formerly. See Fig. 40. See also DEMAND FUNCTION, INCOME-ELASTICITY OF DEMAND.
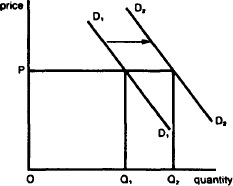
Fig. 40 Demand curve (shift in). An increase in income shifts the demand curve D1D1 to D2D2, increasing the quantity demanded from OQ1, to OQ2. The magnitude of this shift depends upon the INCOME ELASTICITY OF DEMAND for the product.
demand deposit see BANK DEPOSIT, COMMERCIAL BANK.
demand elasticity see ELASTICITY OF DEMAND.
demand for a factor input see DERIVED DEMAND.
demand function a form of notation that links the DEPENDENT VARIABLE, quantity demanded (Qd), with various INDEPENDENT VARIABLES that determine quantity demanded such as product price (P), income (Y), prices of substitute products (Ps), advertising (A), etc.:
Qd = f(P, Y, Ps, A, etc)
Changes in any of these independent variables will affect quantity demanded, and if we wish to investigate the particular effect of any one of these variables upon quantity demanded, then we could (conceptually) hold the influence of the other independent variables constant (CETERIS PARIBUS), whilst we focus upon the particular effects of that independent variable. See DEMAND CURVE, DEMAND CURVE (SHIFT IN).

demand management or stabilization policy
The control of the level of AGGREGATE DEMAND in an economy, using FISCAL POLICY and MONETARY POLICY to moderate or eliminate fluctuations in the level of economic activity associated with the BUSINESS CYCLE. The general objective of demand management is to ‘fine-tune’ aggregate demand so that it is neither deficient relative to POTENTIAL GROSS NATIONAL PRODUCT (thereby avoiding a loss of output and UNEMPLOYMENT) nor overfull (thereby avoiding INFLATION).
An unregulated economy will tend to go through periods of depression and boom as indicated by the continuous line in Fig. 41. Governments generally try to smooth out such fluctuations by stimulating aggregate demand when the economy is depressed and reducing aggregate demand when the economy is over-heating. Ideally, the government would wish to manage aggregate demand so that it grows exactly in line with the underlying growth of potential GNP, the dashed line in Fig. 41, exactly offsetting the amplitude of troughs and peaks of the business cycle.
Two main problems exist, however:
(a) the establishment of the correct timing of such an INJECTION or WITHDRAWAL;
(b) the establishment of the correct magnitude of an injection or withdrawal into the economy (to counter depressions and booms). With perfect timing and magnitude, the economy would follow the trend line of potential GNP.
A number of stages are involved in applying a stabilization policy as shown in the figure. For example, at time period zero the onset of a recession/depression would be reflected in a downturn in economic activity, although delays in the collection of economic statistics means that it is often time period 1 before data becomes available about unemployment rates, etc. Once sufficient data is to hand, the authorities are able to diagnose the nature of the problem (time period 2) and to plan appropriate intervention, such as tax cuts or increases in government expenditure (time period 3). At time period 4, the agreed measures are then implemented, although it may take some time before these measures have an effect on CONSUMPTION, INVESTMENT, IMPORTS, etc. (see MULTIPLIER). If the timing of these activities is incorrect, then the authorities may find that they have stimulated the economy at a time when it was already beginning to recover from recession/depression, so that their actions have served to exacerbate the original fluctuation (dotted line 1 in Fig. 41). The authorities could also exacerbate the fluctuation (dotted line 1) if they get the magnitudes wrong by injecting too much purchasing power into the economy, creating conditions of excess demand.
If the authorities can get the timing and magnitudes correct, then they should be able to counterbalance the effects of recession/depression and follow the path indicated as dotted line 2 in Fig. 41. Reducing the intensity of the recession in this way requires the authorities to FORECAST accurately the onset of recession some time demand management ahead, perhaps while the economy is still buoyant (time period 6). On the basis of these forecasts, the authorities can then plan their intervention to stimulate the economy (time period 7), activate these measures (time period 8), so that these measures begin to take effect and stimulate the economy as economic activity levels fall (time period 9).
Much government action is inaccurate in timing because of the institutional and behavioural complexities of the economy. Where the government has not been successful in adequately eradicating such peaks and troughs in the business cycle, it is frequently accused of having stop-go policies (see STOP-GO CYCLE), that is, of making injections into a recovering economy, which then ‘overheats’, and subsequently withdrawing too much at the wrong time, ‘braking’ too hard.
Demand management represents one facet of government macroeconomic policy, other important considerations being SUPPLY-SIDE policies, which affect the rate of growth of potential GNP, and EXCHANGE RATE policies, which affect the competitiveness of internationally traded goods and services. See DEFLATIONARY GAP, INFLATIONARY GAP, EQUILIBRIUM LEVEL OF NATIONAL INCOME, AUTOMATIC (BUILT-IN) STABILIZERS, INTERNAL-EXTERNAL BALANCE MODEL, PUBLIC FINANCE, BUDGET.
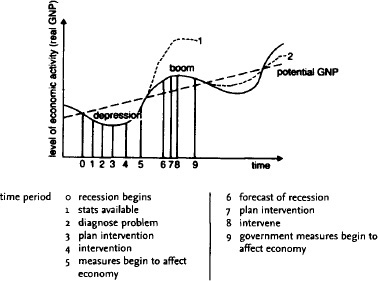
Fig. 41 Demand management. The management of aggregate demand in an economy.

demand-pull inflation a general increase in prices caused by a level of AGGREGATE DEMAND in excess of the supply potential of the economy. At full employment levels of output (POTENTIAL GROSS NATIONAL PRODUCT), excess demand bids up the price of a fixed real output (see INFLATIONARY GAP). According to MONETARISM, excess demand results from too rapid an increase in the MONEY SUPPLY. See INFLATION, QUANTITY THEORY OF MONEY, COST-PUSH INFLATION.
demand schedule a table listing various prices of a product and the specific quantities demanded at each of these prices. The information provided by a demand schedule can be used to construct a DEMAND CURVE showing the price-quantity demanded relationship in graphical form.
demand theory see THEORY OF DEMAND.
demerger the break-up of a company, often originally formed through a MERGER, into two (or more) separate companies. This is most easily achieved when the original businesses comprising the merger have continued to be run as separate divisions of the enlarged group. In this case, for example, the A-B company could be split into separate quoted companies, A and B, with the company’s existing shareholders being given shares in both companies. Thus, unlike a DIVESTMENT (the sale of a division to outside interests) or a MANAGEMENT BUY-OUT (the sale of a division to its existing management), initially at least the companies continue to be owned by their existing shareholders.
A demerger may occur because the merged company has failed to perform up to expectations because of internal conflicts of management, or may result from a rethink of the company’s BUSINESS STRATEGY favouring a concentration on ‘core’ businesses.
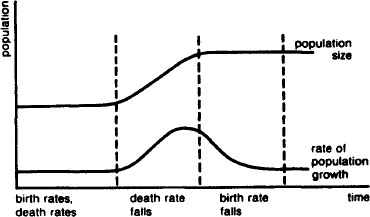
Fig. 42 Demographic transition. The levelling-off of the rate of population growth during a country’s economic development.
demographic transition a POPULATION cycle that is associated with the ECONOMIC DEVELOPMENT of a country. In underdeveloped countries (i.e. subsistence agrarian economics), BIRTH RATES and DEATH RATES are both high, so there is very little change in the overall size of the population. With economic development (i.e. INDUSTRIALIZATION), INCOME PER HEAD begins to rise and there is a fall in the DEATH RATE (through better nutrition, sanitation, medical care, etc.), which brings about a period of rapid population growth. Provided ECONOMIC GROWTH is consistently greater than the increase in population, income per head continues to expand and eventually serves to reduce the BIRTH RATE (small families become the ‘norm’ in society as people seek to preserve their growing affluence). At this point, population growth slows down and may eventually level off. See Fig. 42.
Most advanced industrial countries have gone through a demographic transition of the kind described above and are today characterized by both low birth and death rates and slow-growing populations. See POPULATION TRAP, DEVELOPING COUNTRY.
denationalization see PRIVATIZATION.
demography the study of human POPULATIONS, including their total size, population changes over time as determined by changes in BIRTH RATES, DEATH RATES and MIGRATION; the age and sex distribution of populations and their geographical and occupational distributions. Statistical data on populations is compiled from CENSUSES of population and records of births, See DEMOGRAPHIC TRANSITION.
Department for Education and Skills (DfES) the UK government department responsible for administering the government’s general educational programmes, including schools, colleges and universities, and vocational training schemes. The Department for Education and Skills replaced part of the former Department for Education and Employment in 2001. The emphasis in education is one of providing young people with a basic general education through schools, followed by further education opportunities at colleges and universities, with a commitment thereafter to ‘lifetime learning’ so as to equip people with the necessary basic and vocational skills to be able to adapt to the changing needs of the workplace. This is augmented by more specialized vocational schemes to match up people’s educational capabilities with the practical requirements of specific work tasks through ‘on-the-job-training’ (see TRAINING) and the provision of courses designed to teach people new skills (e.g. computer programming courses). See LEARNING AND SKILLS COUNCIL.
Department for International Development (DFID) the UK government department responsible for administering the government’s policies of promoting sustainable development and reducing poverty in DEVELOPING COUNTRIES. The DFID itself provides ECONOMIC AID and works with various multilateral institutions such as the WORLD BANK and the United Nations to provide financial and technical aid to poor countries.
Department for the Environment, Food and Rural Affairs (DEFRA) the UK body responsible for government policies on agriculture, horticulture, fisheries and the food chain; POLLUTION issues relating to waste and recycling; the enhancement and protection of the countryside, waterways and flood defence, hunting, and rural development issues. See ENVIRONMENT AGENCY.
Department for Transport the UK government department responsible for administering government policies relating to the roads, railways, aviation and shipping.
Department for Work and Pensions (DWP) the UK government department responsible for administering the government’s employment and social security programmes. The DWP was formed in 2001 from parts of the former Department of Social Security and Department for Education and Employment and the Employment Service.
The department assists UNEMPLOYED people of working age into employment, helps employers to fill VACANCIES and provides financial support to persons unable to help themselves through ‘back-to-work’ programmes.
The DWP also administers the SOCIAL SECURITY BENEFITS system, paying state pensions, sickness benefit, child support and the JOBSEEKERS ALLOWANCE.
In 2002 the former Benefits Agency and the Employment Service were replaced by the JOBCENTRE PLUS network (responsible for helping people to find jobs and paying benefits to people of working age) and the Pension Service (responsible for paying state pensions).
Regarding employment, a particular concern of the Department is to instil in people a culture of employment as being the norm but at the same time playing down the negative aspects of unemployment. This more positive approach is reflected in the work of the DWP’s agency Jobcentre Plus and its nationwide network of JOB CENTRES, the introduction of the jobseekers allowance as a replacement for unemployment benefit and the NEW DEAL programme aimed at reducing youth unemployment and long-term unemployment amongst older workers.
The DWP is also responsible for conducting the fact-finding LABOUR FORCE SURVEY, which provides data on conditions in the labour market, for overseeing the application of the UK’s EMPLOYMENT LAWS, and for implementing employee rights’ regulations issued by the European Union (see, for example, the WORKING TIME REGULATION).
Department of Health (DoH) the UK government department responsible for administering the National Health Service.
Department of Social Security see DEPARTMENT FOR WORK AND PENSIONS.
department store a large RETAIL OUTLET. Department stores may be under single-shop ownership or run as a multiple CHAIN STORE business. Unlike most other retailers, who tend to specialize in relatively narrow ranges of products, the essential characteristic of a department store is the great variety of products it stocks: ‘everything under one roof’. See RETAILER, DISTRIBUTION CHANNEL.
Department of Trade and Industry (DTI) the UK government office that is primarily responsible for implementing and administering the government’s industrial and trade policies. A particular concern at the DTI is the promotion of greater efficiency through an INDUSTRIAL POLICY programme that includes support for new business start-ups, consultancy services for small firms, research and development, and technology transfer. In the past, the DTI has been required by governments to involve itself in the rationalization of declining industries and support for ‘failing’ firms, but at the present time the emphasis is very much on fostering greater ‘enterprise’ by business itself with a minimum of direct state intervention. See SMALL BUSINESS SERVICE, BUSINESS LINK.
The DTI is responsible for the operation of REGIONAL POLICY, vetting applications for regional selective assistance by firms investing in ASSISTED AREAS. The DTI works closely with the OFFICE OF FAIR TRADING in matters affecting COMPETITION POLICY; the DTI regulates the formation of companies and their conduct, through the COMPANY REGISTRAR, and is responsible for issuing licences to deposit-taking institutions and authorizing dealers in stocks and shares, etc. (see FINANCIAL SERVICES ACT 1986). Finally, the DTI plays a prominent part in the running of the UK’s overseas trade and investment affairs, representing the country’s interests at international (WORLD TRADE ORGANIZATION) and regional levels (EUROPEAN UNION). The DTI is important in the promotion of exports and foreign investment through the TRADE PARTNERS network and related back-up facilities and services including the EXPORT CREDIT GUARANTEE DEPARTMENT.