Полная версия:
Economics
The alternative view of advertising emphasizes its role as one of expanding market demand and ensuring that firms’ demand is maintained at levels that enable them to achieve economies of large-scale production (see ECONOMIES OF SCALE). Thus, advertising may be associated with a higher market output and lower prices than allowed for in the static model. This is illustrated in Fig. 3 (b).
advertising agency a business that specializes in providing marketing services for firms. Agencies usually devise, programme and manage specific advertising campaigns on behalf of clients. See ADVERTISEMENT, ADVERTISING.
Advertising Standards Authority (ASA) a body that regulates the UK ADVERTISING industry to ensure that ADVERTISEMENTS provide a fair, honest and unambiguous representation of the products they promote.
Advisory, Conciliation and Arbitration Service (ACAS) a body established in the UK in 1975 to provide counselling services with regard to INDUSTRIAL RELATIONS and employment policy matters, in particular that of MEDIATION, CONCILIATION and ARBITRATION in cases of INDUSTRIAL DISPUTE.
after-sales service the provision of back-up facilities by a supplier or his agent to a customer after he has purchased the product. After-sales service includes the replacement of faulty products or parts and the repair and maintenance of the product on a regular basis. These services are often provided free of charge for a limited period of time through formal guarantees of product quality and performance, and thereafter, for a modest fee, as a means of securing continuing customer goodwill. After-sales service is thus an important part of competitive strategy. See PRODUCT DIFFERENTIATION.
agency cost a form of failure in the contractual relationship between a PRINCIPAL (the owner of a firm or other assets) and an AGENT (the person contacted by the principal to manage the firm or other assets). This failure arises because the principal cannot fully monitor the activities of the agent. Thus there is a possibility that an agent may not act in the interests of his principal, unless the principal can design an appropriate reward structure for the agent that aligns the agent’s interests with those of the principal.
Agency relations can exist between firms, for example, licensing and franchising arrangements between the owner of a branded product (the principal) and licensees who wish to make and sell that product (agents). However, agency relations can also exist within firms, particularly in the relationship between the shareholders who own a public JOINT-STOCK COMPANY (the principals) and salaried professional managers who run the company (the agents). Agency costs can arise from slack effort by employees and the cost of monitoring and supervision designed to deter slack effort. See PRINCIPAL-AGENT THEORY, CONTRACT, TRANSACTION, DIVORCE OF OWNERSHIP FROM CONTROL, MANAGERIAL THEORIES OF THE FIRM, TEAM PRODUCTION.
agent a person or company employed by another person or company (called the principal) for the purpose of arranging CONTRACTS between the principal and third parties. An agent thus acts as an intermediary in bringing together buyers and sellers of a good or service, receiving a flat or sliding-scale commission, brokerage or fee related to the nature and comprehensiveness of the work undertaken and/or value of the transaction involved. Agents and agencies are encountered in one way or another in most economic activities and play an important role in the smooth functioning of the market mechanism. See PRINCIPAL-AGENT THEORY for discussion of ownership and control issues as they affect the running of companies. See ESTATE AGENT, INSURANCE BROKER, STOCKBROKER, DIVORCE OF OWNERSHIP FROM CONTROL.
aggregate concentration see CONCENTRATION MEASURES.
aggregate demand or aggregate expenditure the total amount of expenditure (in nominal terms) on domestic goods and services. In the CIRCULAR FLOW OF NATIONAL INCOME MODEL aggregate demand is made up of CONSUMPTION EXPENDITURE (C), INVESTMENT EXPENDITURE (I), GOVERNMENT EXPENDITURE (G) and net EXPORTS (exports less imports) (E):
aggregate demand = C + I + G + E
Some of the components of aggregate demand are relatively stable and change only slowly over time (e.g. consumption expenditure); others are much more volatile and change rapidly, causing fluctuations in the level of economic activity (e.g. investment expenditure).
In 2003, consumption expenditure accounted for 52%, investment expenditure accounted for 13%, government expenditure accounted for 15% and exports accounted for 20% of gross final expenditure (GFE) on domestically produced output. (GFE minus imports = GROSS DOMESTIC PRODUCT). See Fig. 133 (a) NATIONAL INCOME ACCOUNTS.
Aggregate demand interacts with AGGREGATE SUPPLY to determine the EQUILIBRIUM LEVEL OF NATIONAL INCOME. Governments seek to regulate the level of aggregate demand in order to maintain FULL EMPLOYMENT, avoid INFLATION, promote ECONOMIC GROWTH and secure BALANCE-OF-PAYMENTS EQUILIBRIUM through the use of FISCAL POLICY and MONETARY POLICY. See AGGREGATE DEMAND SCHEDULE, ACTUAL GROSS NATIONAL PRODUCTS DEFLATIONARY GAP, INFLATIONARY GAP, BUSINESS CYCLE, STABILIZATION POLICY, POTENTIAL GROSS NATIONAL PRODUCT.
aggregate demand/aggregate supply approach to national income determination see EQUILIBRIUM LEVEL OF NATIONAL INCOME.
aggregate demand schedule a schedule depicting the total amount of spending on domestic goods and services at various levels of NATIONAL INCOME. It is constructed by adding together the CONSUMPTION, INVESTMENT, GOVERNMENT EXPENDITURE and EXPORTS schedules, as indicated in Fig. 4 (a).
A given aggregate demand schedule is drawn up on the usual CETERIS PARIBUS conditions. It will shift upwards or downwards if some determining factor changes. See Fig. 4 (b).
Alternatively, the aggregate demand schedule can be expressed in terms of various levels of real national income demanded at each PRICE LEVEL as shown in Fig. 4 (c). This alternative schedule is also drawn on the assumption that other influences on spending plans are constant. It will shift rightwards or leftwards if some determining factors change. See Fig. 4 (d). This version of the aggregate demand schedule parallels at the macro level the demand schedule and DEMAND CURVE for an individual product, although in this case the schedule represents demand for all goods and services and deals with the general price level rather than with a particular price.
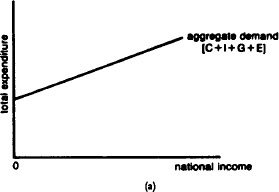
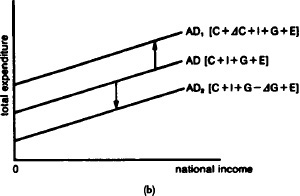
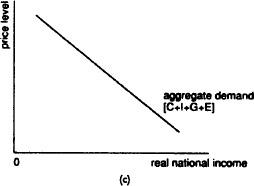
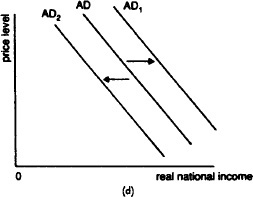
Fig. 4 Aggregate demand schedule. (a) The graph shows how AGGREGATE DEMAND varies with the level of NATIONAL INCOME. b) Shifts in the schedule because of determining factor changes. For example, if there is an increase in the PROPENSITY TO CONSUME, the consumption schedule will shift upwards, serving to shift the aggregate demand schedule upwards from AD to AD1; a reduction in government spending will shift the schedule downwards from AD to AD2. (c)The graph plots the quantity of real national income demanded against the price level. (d) Shifts in the schedule because of determining factor changes. For example, if there is an increase in the propensity to consume, the aggregate demand schedule will shift rightwards from AD to AD1; a reduction in government spending will shift the schedule leftwards from AD to AD2.
aggregated rebate a trade practice whereby DISCOUNTS on purchases are related not to customers’ individual orders but to their total purchases over a period of time. Aggregated rebate is used to foster buyer loyalty to the supplier, but it can produce anti-competitive effects because it encourages buyers to place the whole of their orders with one supplier, to the exclusion of competing suppliers. Under the Competition Act 1980, aggregated rebates can be investigated by the Office of Fair Trading and (if necessary) the COMPETITION COMMISSION and prohibited if found to unduly restrict competition.
aggregate expenditure see AGGREGATE DEMAND.
aggregate supply the total amount of domestic goods and services supplied by businesses and government, including both consumer products and capital goods. Aggregate supply interacts with AGGREGATE DEMAND to determine the EQUILIBRIUM LEVEL OF NATIONAL INCOME (see AGGREGATE SUPPLY SCHEDULE).
In the short term, aggregate supply will tend to vary with the level of demand for goods and services, although the two need not correspond exactly. For example, businesses could supply more products than are demanded in the short term, the difference showing up as a build-up of unsold STOCKS (unintended INVENTORY INVESTMENT). On the other hand, businesses could supply fewer products than are demanded in the short term, the difference being met by running down stocks. However, discrepancies between aggregate supply and aggregate demand cannot be very large or persist for long, and generally businesses will offer to supply output only if they expect spending to be sufficient to sell all that output.
Over the long term, aggregate supply can increase as a result of increases in the LABOUR FORCE, increases in CAPITAL STOCK and improvements in labour PRODUCTIVITY. See ACTUAL GROSS NATIONAL PRODUCT, POTENTIAL GROSS NATIONAL PRODUCT, ECONOMIC GROWTH.
aggregate supply schedule a schedule depicting the total amount of domestic goods and services supplied by businesses and government at various levels of total expenditure. The AGGREGATE SUPPLY schedule is generally drawn as a 45° line because business will offer any particular level of national output only if they expect total spending (AGGREGATE DEMAND) to be just sufficient to sell all of that output. Thus, in Fig. 5 (a), £100 million of expenditure calls forth £100 million of aggregate supply, £200 million of expenditure calls forth £200 million of aggregate supply, and so on. This process cannot continue indefinitely, however, for once an economy’s resources are fully employed in supplying products then additional expenditure cannot be met from additional domestic resources because the potential output ceiling of the economy has been reached. Consequently, beyond the full-employment level of national product, Yf, the aggregate supply schedule becomes vertical. See POTENTIAL GROSS NATIONAL PRODUCT, ACTUAL GROSS NATIONAL PRODUCT.
Alternatively, the aggregate supply schedule can be expressed in terms of various levels of real national income supplied at each PRICE LEVEL as shown in Fig. 5 (b). This version of the aggregate supply schedule parallels at the macro level the supply schedule and SUPPLY CURVE for an individual product, though in this case the schedule represents the supply of all goods and services and deals with the general price level rather than a particular product price. Fig. 5 (c) shows a shift of the aggregate supply curve to the right as a result of, for example, increases in the labour force or capital stock and technological advances.
Aggregate supply interacts with aggregate demand to determine the EQUILIBRIUM LEVEL OF NATIONAL INCOME.
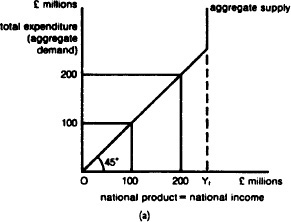
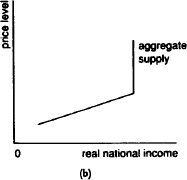
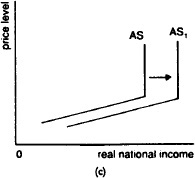
Fig. 5 Aggregate supply schedule. See entry.
AGM see ANNUAL GENERAL MEETING.
agricultural policy a policy concerned both with protecting the economic interests of the agricultural community by subsidizing farm prices and incomes, and with promoting greater efficiency by encouraging farm consolidation and mechanization.
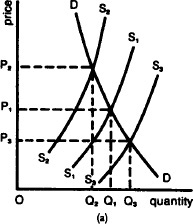
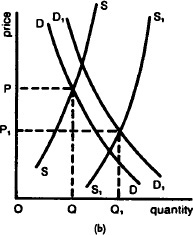
Fig. 6 Agricultural policy. (a) The short-term shifts in supply (S) and their effects on price (P) and quantity (Q). (b) Long-term shifts caused by the influence of productivity improvement on supply.
The rationale for supporting agriculture partly reflects the ‘special case’ nature of the industry itself: agriculture, unlike manufacturing industry, is especially vulnerable to events outside its immediate control. Supply tends to fluctuate erratically from year to year, depending upon such vagaries as the weather and the incidence of pestilence and disease, S1, S2 and S3 in Fig. 6 (a), causing wide changes in farm prices and farm incomes. Over the long term, while the demand for many basic foodstuffs and animal produce has grown only slowly, from DD to D1D1 in Fig. 6 (b), significant PRODUCTIVITY improvements associated with farm mechanization, chemical fertilizers and pesticides, etc., have tended to increase supply at a faster rate than demand, from SS to S1S1 in Fig. 6 (b), causing farm prices and incomes to fall (see MARKET FAILURE).
Farming can thus be very much a hit-and-miss affair, and governments concerned with the impact of changes in food supplies and prices (on, for example, the level of farm incomes, the balance of payments and inflation rates) may well feel some imperative to regulate the situation. But there are also social and political factors at work; for example, the desire to preserve rural communities and the fact that, even in some advanced industrial countries (for example, the European Union), the agricultural sector often commands a political vote out of all proportion to its economic weight. See ENGEL’S LAW, COBWEB THEOREM, PRICE SUPPORT, INCOME SUPPORT, COMMON AGRICULTURAL POLICY, FOOD AND AGRICULTURAL ORGANIZATION.
aid see ECONOMIC AID.
allocative efficiency an aspect of MARKET PERFORMANCE that denotes the optimum allocation of scarce resources between end users in order to produce that combination of goods and services that best accords with the pattern of consumer demand. This is achieved when all market prices and profit levels are consistent with the real resource costs of supplying products. Specifically, consumer welfare is optimized when for each product the price is equal to the lowest real resource cost of supplying that product, including a NORMAL PROFIT reward to suppliers. Fig. 7 (a) depicts a normal profit equilibrium under conditions of PERFECT COMPETITION with price being determined by the intersection of the market supply and demand curves and with MARKET ENTRY/MARKET EXIT serving to ensure that price (P) is equal to minimum supply cost in the long run (AC).
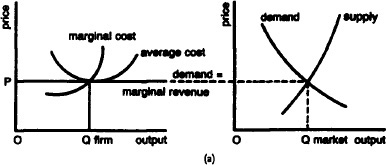
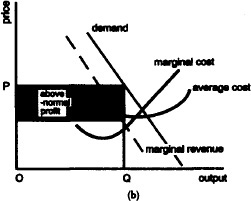
Fig. 7 Allocative efficiency. (a) A normal profit equilibrium under conditions of perfect competition. (b) The profit maximizing price-output combination for a monopolist.
By contrast, where some markets are characterized by monopoly elements, then in these markets output will tend to be restricted so that fewer resources are devoted to producing these products than the pattern of consumer demand warrants. In these markets, prices and profit levels are not consistent with the real resource costs of supplying the products. Specifically, in MONOPOLY markets the consumer is exploited by having to pay a price for a product that exceeds the real resource cost of supplying it, this excess showing up as an ABOVE-NORMAL PROFIT for the monopolist.
Fig. 7 (b) depicts the profit maximizing price-output combination for a monopolist, determined by equating marginal cost and marginal revenue. This involves a smaller output and a higher price than would be the case under perfect competition, with BARRIERS TO ENTRY serving to ensure that the output restriction and excess prices persist over the long run. See PARETO OPTIMALITY, MARKET FAILURE.
Alternative Investment Market see UNLISTED-SECURITIES MARKET.
amalgamation see MERGER.
Amsterdam Treaty, 1997 a EUROPEAN UNION (EU) statute that extended various provisions of the MAASTRICHT TREATY in the areas of social policy (particularly discriminations against persons and the integration of the SOCIAL CHAPTER), internal procedures for the administration of EU institutions and the EU’s Common Foreign and Security Policy (including defence).
Andean Pact a regional alliance originally formed in 1969 with the general objective of establishing a COMMON MARKET. The current members of the Andean Pact are Peru, Chile, Ecuador, Columbia and Bolivia. By the mid 1980s, however, it had all but collapsed because of various economic and political instabilities. The Pact was relaunched in 1990 minus Chile but with a new member, Venezuela, renewing its commitment to the eventual introduction of a common market. See TRADE INTEGRATION.
annual general meeting (AGM) the yearly meeting of SHAREHOLDERS that JOINT-STOCK COMPANIES are required by law to convene, in order to allow shareholders to discuss their company’s ANNUAL REPORT AND ACCOUNTS, elect members of the BOARD OF DIRECTORS and agree the DIVIDEND payouts suggested by directors. In practice, annual general meetings are usually poorly attended by shareholders and only rarely do directors fail to be re-elected on the strength of PROXY votes cast in favour of the directors. See CORPORATE GOVERNANCE.
annual report and accounts a yearly report by the directors of a JOINT-STOCK COMPANY to the SHAREHOLDERS. It includes a copy of the company’s BALANCE SHEET and a summary PROFIT-AND-LOSS ACCOUNT, along with other information that directors are required by law to disclose to shareholders. A copy of the annual report and accounts is sent to every shareholder prior to the company’s ANNUAL GENERAL MEETING.
annuity a series of equal payments at fixed intervals from an original lump sum INVESTMENT. Where an annuity has a fixed time span, it is termed an annuity certain, and the periodic receipts comprise both a phased repayment of principal (the original lump sum payment) and interest, such that at the end of the fixed term there is a zero balance on the account. An annuity in perpetuity does not have a fixed time span but continues indefinitely and receipts can therefore come only from interest earned. Annuities can be obtained from pension funds or life insurance schemes.
anticipated inflation the future INFLATION rate in a country that is generally expected by business people, trade union officials and consumers. People’s anticipations about the inflation rate will influence their price-setting, wage bargaining and spending/saving decisions. As part of its policy to reduce inflation, governments seek to influence anticipations by ‘talking down’ prospects of inflation, publishing norm percentages for prices and incomes, etc. Compare UNANTICIPATED INFLATION. See EXPECTATIONS, EXPECTATIONS-ADJUSTED/AUGMENTED PHILLIPS CURVE.
anti-competitive agreement a form of COLLUSION between suppliers aimed at restricting or removing competition between them. For the most part, such agreements concentrate on fixing common selling prices and discounts but may also contain provisions relating to market-sharing, production quotas and coordinated capacity adjustments. The main objection to such agreements is that they raise prices above competitive levels, impose unfair terms and conditions on buyers and serve to protect inefficient suppliers from the rigours of competition. In the UK, anti-competitive agreements are prohibited by the COMPETITION ACT 1998. See also RESTRICTIVE PRACTICES COURT.
anti-competitive practice a commercial practice operated by a firm that has the effect of restricting, distorting or eliminating competition (especially if operated by a dominant firm) to the detriment of other suppliers and consumers. Examples of restrictive practices include EXCLUSIVE DEALING, REFUSAL TO SUPPLY, FULL LINE FORCING, TIE-IN SALES, AGGREGATED REBATES, RESALE PRICE MAINTENANCE and LOSS LEADING.
Under the COMPETITION ACT 1980, exclusive dealing, full line forcing, tie-in sales and aggregated rebates can be investigated by the OFFICE OF FAIR TRADING and (if necessary) the COMPETITION COMMISSION and prohibited if found to unduly restrict competition. The RESALE PRICES ACTS 1964, 1976 make the practice of resale price maintenance illegal unless it is, very exceptionally, exempted by the Office of Fair Trading. See also PRICE SQUEEZE.
anti-dumping duty see COUNTERVAILING DUTY.
antimonopoly policy see COMPETITION POLICY.
antitrust policy see COMPETITION POLICY.
APEC see ASIAN PACIFIC ECONOMIC COOPERATION.
application money the amount payable per share on application for a new SHARE ISSUE.
applied economics the application of economic analysis to real world economic situations. Applied economics seeks to employ the predictions emanating from ECONOMIC THEORY in offering advice on the formulation of ECONOMIC POLICY. See ECONOMIC MODELS, HYPOTHESIS, HYPOTHESIS TESTING.
appreciation 1 an increase in the value of a CURRENCY against other currencies under a FLOATING EXCHANGE-RATE SYSTEM. An appreciation of a currency’s value makes IMPORTS (in the local currency) cheaper and EXPORTS (in the local currency) more expensive, thereby encouraging additional imports and curbing exports, so assisting in the removal of a BALANCE OF PAYMENTS surplus and the excessive accumulation of INTERNATIONAL RESERVES.
How successful an appreciation is in removing a payments surplus depends on the reactions of export and import volumes to the change in relative prices; that is, the PRICE ELASTICITY OF DEMAND for exports and imports. If these values are low, i.e. demand is inelastic, trade volume will not change very much and the appreciation may in fact make the surplus larger. On the other hand, if export and import demand is elastic then the change in trade volumes will operate to remove the surplus, BALANCE-OF-PAYMENTS EQUILIBRIUM will be restored if the sum of export and import elasticities is greater than unity (the MARSHALL-LERNER CONDITION). See REVALUATION for further points. Compare DEPRECIATION 1. See INTERNAL-EXTERNAL BALANCE MODEL. 2 an increase in the price of an ASSET and also called capital appreciation. Assets held for long periods, such as factory buildings, offices or houses, are most likely to appreciate in value because of the effects of INFLATION and increasing site values, though the value of short-term assets like STOCKS can also appreciate. Where assets appreciate, then their REPLACEMENT COST will exceed their HISTORIC COST, and such assets may need to be revalued periodically to keep their book values in line with their market values. See DEPRECIATION 2, INFLATION ACCOUNTING.
apprentice see TRAINING.
APR the ‘annualized percentage rate of INTEREST’ charged on a LOAN. The APR rate will depend on the total ‘charge for credit’ applied by the lender and will be influenced by such factors as the general level of INTEREST RATES, and the nature and duration of the loan.


