Полная версия:
Все науки. №10, 2024. Международный научный журнал
2.3.1. PSD & PHA firmware
For nuclear reactions spectroscopy, we are particularly interested in two f irmware packages dedicated to DPP: PSD and PHA. Both are available in MARS. The PSD firmware allows for integrating incoming pulses and producing an energy spectrum. The selection of events can be done by means of a leading edge discriminator (LED) or a constant fraction discriminator (CFD). It features a double gate integration of the input in order to calculate the PSD factor, given by:

where Qlong and Qshort are the integrated charges in the long and short gates (Figure 2a). It represents the ratio between the signal tail and the total inte gral. PSD is suitable for processing pulses with fast decay time, such as those produced by electrons, gammas, and neutrons in scintillation detectors [24]. The PHA firmware allows the digitizer to obtain an energy spectrum by applying a trapezoidal filter to the input pulse. It transforms the typical expo nential decay pulse, generated by a detector (and transmitted through a pream plifier), into a trapezoidal signal whose height is proportional to the input pulse amplitude. The height of the trapezoid is measured at the peaking time (see Figure 2b). This firmware is ideal for processing pulses with long decay times, such as those produced by alphas and heavy ions in semiconductor detectors [24]. This is the case for charged fragments resulting from nuclear reactions. Therefore, we will report on the PHA firmware from now on.
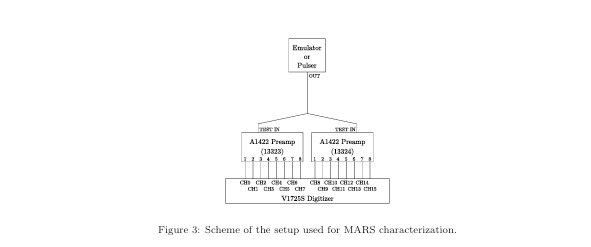
Figure 3: Scheme of the setup used for MARS characterization.
3. MARS characterization
As a proof of concept and validation, MARS has been firstly tested in a laboratory environment. Figure 3 schematize the first setup used to characterize the MARS electronic system. The test pulses were generated by the 419 ORTEC precision pulse generator [25] or the digital detector emulator DT4800 [26]. Both modules allow for emulating electronic pulses that simulate the detection of a charged particle in a silicon detector. The former works at a fixed frequency of 70 ± 10 Hz [25], while the latter can be set to different values. The DT4800 allows for emulating pulses with time and amplitude follow ing Poisson distributions. It allows for loading spectra from different sources, simulating their emission rate and pulse height distribution. It also allows for modifying the rise and decay times of the pulses. It is worth mentioning that pulses were initially delivered through the com monTESTIN (input) of A1422 preamplifiers. In practice, the electronic signals, coming from detectors, must be transmitted through individual DET IN elec tronic chains. However, unlike DET IN, TEST IN has a 50 Ω termination in series with a 1 pF capacitance. Further measurements were performed using a triple alpha source placed in front of detectors, which were then connected to individual A1422 DET IN. According to Figure 3, MARS system is divided into 8 individual electronic chains (1- 8) related to each A1422 (13323 and 13324) preamplifier and 16 data acquisition (DAQ) chains (0- 15) related to the V1725S digitizer. These numbers coincide with the numbers printed, respectively, in the front panel of A1422 preamplifiers and V1725S digitizer.
3.1. A1422 preamplifiers response
3.1.1. Pulse height response: the IN/OUT relation
Following Figure 3 scheme, using the 419 ORTEC precision pulse generator [25], pulses of different amplitudes have been transmitted, via both A1422 TEST
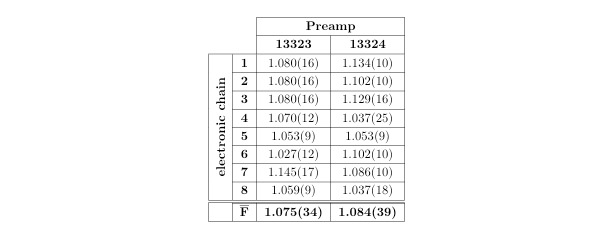
Table 1: Amplification factor (F), of each electronic (A1422) chain and the average value (F) obtained for each module.
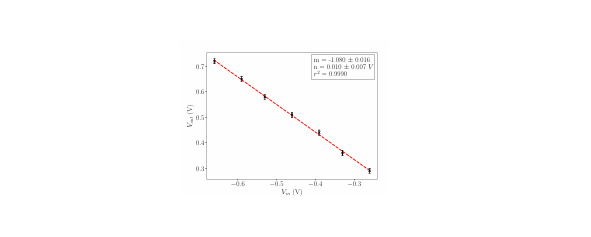
Figure 4: Relation between the input and the output pulse heights for the first electronic chain (1) of the A1422—13323 preamplifier.
IN (input). Pulse amplitudes were then measured, at each individual A1422 output, using a digital oscilloscope from Tektronix, model TBS1072B [27]. Thus, we determine the relation between the amplitudes of the A1422 input and output pulses, i. e. its amplification factor (F). Table 1 presents the amplification factor (F), obtained for each electronic chain (Vout/Vin) and the average value (F), obtained for each A1422. Since preamplifiers invert the pulse, the Table 1 refers to absolute values. In Table 1, the A1422 are discriminated by their series number: 13323 and 13324. From Ta ble 1, the F average values are 1.075 (34) for the A1422—13323 and 1.084 (39) for the A1422—13324. Relative uncertainties are, respectively, 3.2% and 3.6%. Con sidering statistical errors (standard deviation (σ)), both values are compatible in 1σ. As an example, Figure 4 plots the relation between the input and output pulse heights, with the respective fit, for the first electronic chain (1) of the
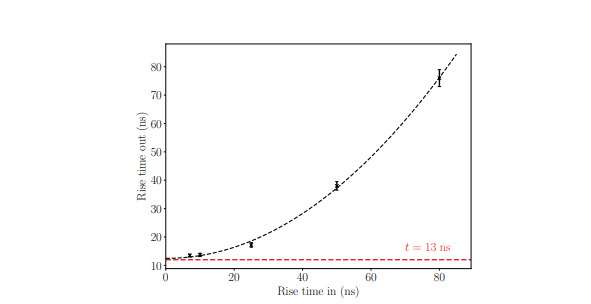
(a) Output rise time as a function of the input rise time. Input pulses with fast rise times (<15 ns), saturate at around 13 ns
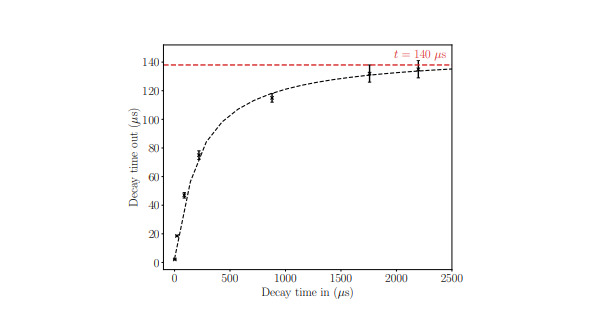
(b) Outputdecaytimeasafunctionoftheinput decaytime.Forlonginputpulses, thedecaytime saturatesataround140µs.
Figure 5: Timing performance of the A1422 preamplifier.
The A1422 preamplifier data sheet [17] specifies a rise time tr <25 ns and a decay time td = 50 µs. Here, the decay time refers to the time it takes for the pulse to fall from the 100% to the 50% of its maximum.
Following Figure 3 scheme, using the digital detector emulator DT4800 [26], the timing performance of the A1422 preamplifiers has been characterized. The rise time of the input pulses represents the charge collection time and it depends on the specific detector. We used the DT4800 emulator to create input pulses with different rise times, studying the A1422 output pulses. The results can be seen in Figure 5a. For input pulses with fast rise times (<15 250 ns), the output pulse rise time remains constant at tr ≈ 13 ns. Therefore, when the input pulses have fast rise times – which is standard when detecting alphas or heavy ions – the characteristic A1422 output rise time (tr ≈ 13 ns) is in agreement with the datasheet value (tr <25 ns). Likewise, the DT4800 emulator can generate input pulses with different decay times, which allows for studying the respective A1422 output pulses. The results are represented in Figure 5b. It can be verified that for long input pulses – which would correspond to alphas or heavy ions – the decay time of the A1422 output pulses remains constant at td ≈ 140 µs. Taking into account foot note 1 and converting to CAEN’s above-mentioned criterion leads to td ≈ 46 µs, that can be compared to the datasheet value (td = 50 µs)
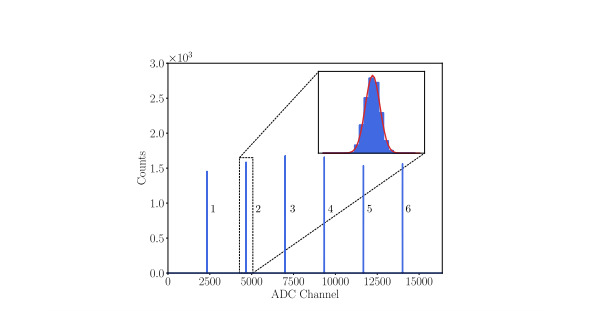
Figure 6: Spectrum obtained for different pulse heights emulated from DT4800, with the setup of Figure 3. Each peak has been fitted using a Gaussian model in order to determine the FWHM
3.2. V1725S digitizer and spectral response
3.2.1. Linearity with an emulated pulse
Using the DT4800 in Figure 3, the linearity of the 16 MARS electronic and acquisition chains has been tested.
We characterized the relation between the input pulse height and the spec trum channel. The total number of spectrum channels was set to 214 = 16384.
Конец ознакомительного фрагмента.
Текст предоставлен ООО «Литрес».
Прочитайте эту книгу целиком, купив полную легальную версию на Литрес.
Безопасно оплатить книгу можно банковской картой Visa, MasterCard, Maestro, со счета мобильного телефона, с платежного терминала, в салоне МТС или Связной, через PayPal, WebMoney, Яндекс.Деньги, QIWI Кошелек, бонусными картами или другим удобным Вам способом.
Вы ознакомились с фрагментом книги.
Для бесплатного чтения открыта только часть текста.
Приобретайте полный текст книги у нашего партнера:
Полная версия книги
Всего 10 форматов