Полная версия:
Comprensive Optimization Decisions Exchange Traders
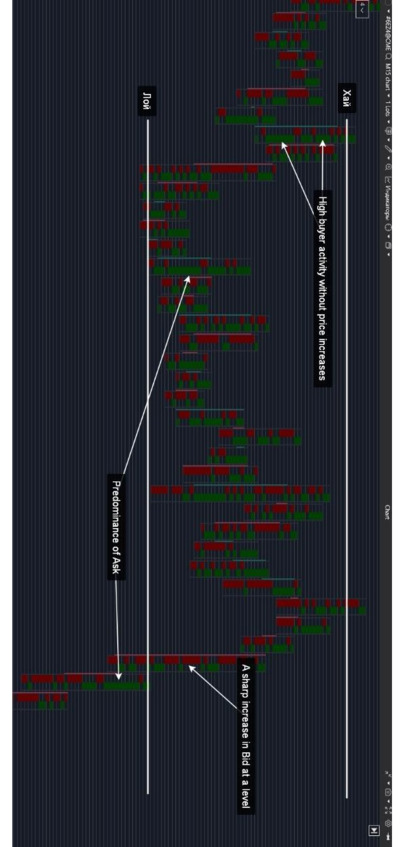
Absorption and Accumulation:
– High Buyer Activity Without Price Increase: Indicates sellers actively holding the market by absorbing buy orders.
– High Seller Activity Without Price Decline: Suggests buyers are maintaining strong positions, preventing the price from falling.
Counteraction at Levels:
– Bid Dominance at Highs: Reflects seller resistance, signaling readiness to defend the level.
– Ask Dominance at Lows: Demonstrates buyers defending the level, preventing the price from dropping further.
Conclusion
Footprint charts visualize market sentiment, helping traders understand participants’ actions at key levels.
Analyzing signals of imbalance, accumulation, and counteraction enables traders to:
– Identify areas of activity by major market players.
– Detect where the market is preparing for a breakout or reversal.
– Make informed trading decisions, reducing the likelihood of errors.
By leveraging this data, traders gain an advantage that helps minimize risks and improve performance.


…


Section 2: Types of Footprint Data
Footprint is not just a set of numbers on a chart; it is the key to understanding market dynamics and provides access to the essence of trading processes. This tool allows you to see what is usually hidden: how volumes are distributed, who controls the market – buyers or sellers – and where the real interests of major participants lie.
Every trade, every tick on the footprint tells its own story. These are not just numbers, but real actions of traders: some are actively buying at market prices, others are placing limit orders to restrain price movement, and some skillfully hide their intentions.
What can be seen on the footprint:
Volumes at price levels:
The footprint shows where large volumes are concentrated, helping identify accumulation and distribution zones. These levels often become strong support or resistance.
Bid and Ask:
You can clearly see how many contracts have been bought (Ask) or sold (Bid) at each level. This helps determine who is dominating – the buyers or the sellers.
Delta:
The difference between the Bid and Ask volumes shows which side has the advantage. Delta helps “read” hidden market sentiment, even if the price is currently stationary.
Speed of trades:
During times of increased activity, the footprint helps track volume spikes and determine whether they are the result of real interest or algorithmic activity.
Why footprint is so important for traders:
Trading is a field where the winner is the one who can see just a little more and think ahead. Footprint helps you take your analysis to the next level.
For example:
– If you see large volumes at the 1500 level but the price isn’t rising, it may mean that sellers are actively “absorbing” the buys. This is a signal to avoid entering a long position.
– If, after a breakout, the Bid volumes sharply increase below the breakout point, it signals the entry of large sellers and the beginning of a new trend.
How footprint differs from traditional analysis:
While traditional charts show the result – where the price has gone – footprint reveals the entire process, answering questions: how and by whom this happened.
– Working with major players: Footprint helps identify where “whales” are accumulating or unloading positions.
– Avoiding traps: You can see where the market is creating the illusion of movement and where true intentions are hidden.
– Real data: Every trade, volume, and level on the footprint is actual data, not assumptions.
Conclusion
Footprint is not just a chart; it is your guide to conscious trading. With it, you will learn to:
Identify key levels.
– Define entry and exit points.
– Read market signals and act ahead of the curve.
This tool will allow you to look behind the scenes of the market, understand the actions of major participants, and make informed trading decisions. Ready to be one step ahead? Welcome to the world of footprint and professional analysis!
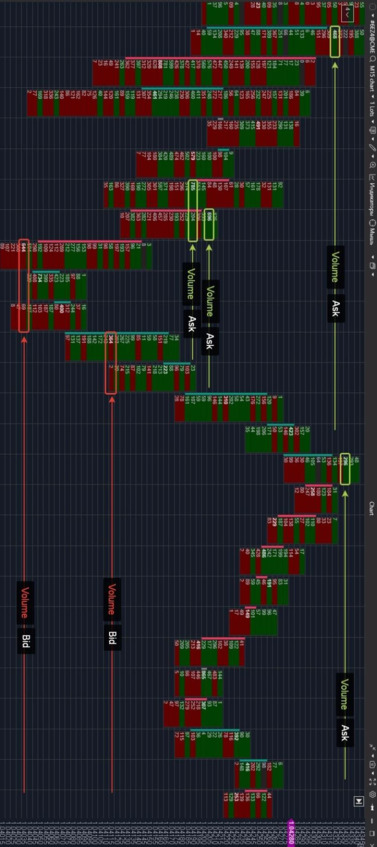
Volume by Price Levels
Transaction volumes at specific price levels are a key analytical tool for identifying support and resistance zones, as well as for assessing market participants’ behavior. These data allow traders to see where large volumes are concentrated and who is controlling price movement.
What Is Volume by Price Level
– It is the total volume of trades (Bid + Ask) executed at a specific price during a given time period.
– High volumes at a level indicate increased interest from market participants.
– By analyzing who dominates at a level – Bid or Ask – traders can determine prevailing market sentiment.
Key Elements of Visualization
Ask Volumes (Green Cells)
Represent the volume of buy trades where buyers accept sellers’ offers.
Example: At the 1.04356 level, the Ask volume is 696 contracts, indicating buyer activity and making it a potential resistance zone.
Bid Volumes (Red Cells)
Indicate the volume of sell trades where sellers fulfill buyers’ demands.
Example: At the 1.04248 level, the Bid volume is 644 contracts, signaling a potential support zone.
Total Volumes
Display the total number of trades executed at each level.
Levels with high total volumes, such as 1.04248 and 1.04356, suggest significant interest from major market participants.
Practical Significance of Volume Analysis
Identifying Support and Resistance Zones:
Levels with large volumes often become critical points where price may slow down or reverse.
Analyzing Activity:
Color-coded volumes (green for buys, red for sells) make it easier to identify market activity.
Assessing Market Sentiment:
A dominance of Ask volumes over Bid (or vice versa) indicates whether buyers or sellers are in control, helping predict future price movement.
Using volume analysis through a footprint chart provides traders with precise insights into market mechanics, enabling them to identify key levels and effectively manage their positions.
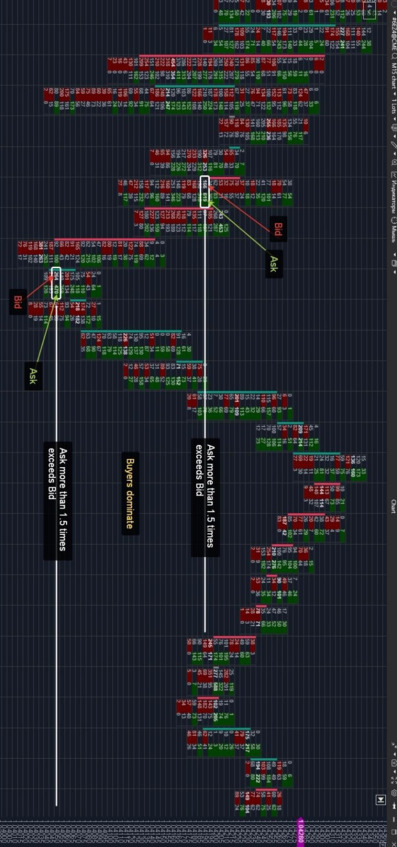
Bid and Ask Balance
Analyzing the balance between buy trades (Ask) and sell trades (Bid) is a crucial tool for understanding market sentiment. This balance allows traders to determine which side – buyers or sellers – is currently dominating.
Comparing Buyer and Seller Activity
– Bid: Sell trades executed at the bid price.
– Ask: Buy trades executed at the ask price.
– Comparing Bid and Ask volumes helps identify market imbalances, indicating which side is in control.
Key Elements of Visualization
– Volumes at Price Levels
Green blocks represent buy volumes (Ask), while red blocks indicate sell volumes (Bid).
Example: At a level with 619 Ask contracts significantly exceeding 166 Bid contracts, buyer activity is evident.
– Comparison of Bid and Ask
Analyzing the volume ratio at different levels:
At levels where Ask exceeds Bid by 1.5 times, strong buying pressure is observed.
These examples are noted across multiple levels, confirming buyer dominance.
– Key Activity Zones
At a level with 470 Ask contracts versus 264 Bid contracts, clear buying dominance is also observed.
Such zones can act as resistance points, where buyers actively prevent the price from falling further.
– Overall Activity Insight
The chart shows evident buyer dominance, as reflected by high Ask volumes at key levels.
This dynamic helps traders understand the current market situation and identify critical levels.
Practical Significance
– Identifying Support and Resistance Zones
High Ask volumes at levels indicate resistance zones where buyers resist further downward movement.
– Assessing Market Sentiment
Imbalances in Bid and Ask volumes reveal which side controls the market.
– Enhancing Trading Strategy
Understanding key activity zones and dominant sides helps avoid false entries and build more precise trading plans.
Using Bid and Ask balance analysis through a footprint chart makes market dynamics more transparent, enabling traders to make informed decisions.
Delta Within the Footprint
Delta is a key metric that represents the difference between buy (Ask) and sell (Bid) volumes at each price level. It helps traders analyze the actions of major market participants and uncover hidden volumes.
What Is Delta Within the Footprint
– Delta represents the difference between buys (Ask) and sells (Bid) at a specific price level.
– Positive delta indicates buying dominance, while negative delta signals selling pressure.
Key Elements of the Visualization
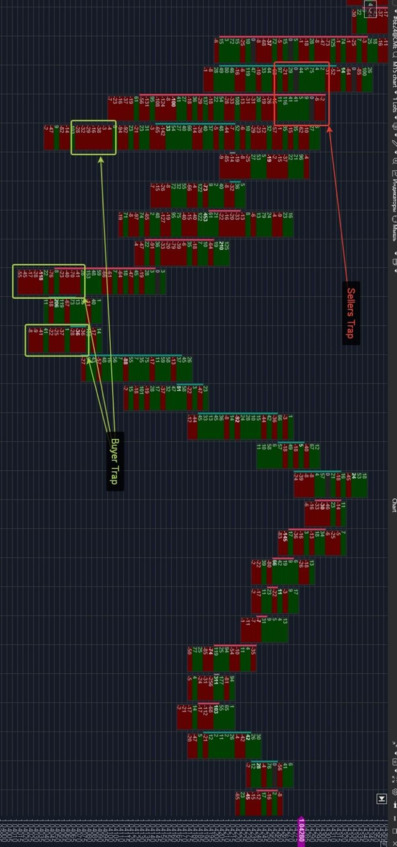
Seller Trap (upper part of the chart)
An area with active selling (Bid), creating the illusion of seller dominance.
Despite high selling volumes, the price does not continue downward. This signals that buyers are absorbing the Bid volumes, forming strong support.
Such a situation can indicate a buying opportunity, as sellers find themselves “trapped” in losing positions.
Buyer Trap (lower part of the chart)
An area with active buying (Ask), where large players artificially stimulate buying interest.
Following this, the price starts to decline, indicating position liquidation by major players and selling pressure.
This is a signal to sell, as buyers are likely to end up in unfavorable positions.
Analysis Examples
At the Seller Trap Level
Bid volumes appear dominant, but the price moves upward, reflecting buyer support.
Such scenarios are often accompanied by actions from major participants forming strong support.
At the Buyer Trap Level
Ask volumes significantly increase, creating the impression of price growth. However, subsequent declines indicate position liquidation by major players.
This is a strong signal of resistance and a shift in market sentiment.
Practical Application for Traders
Identifying Market Traps
Traps help pinpoint areas where the majority of market participants are likely to be in losing positions.
By leveraging these zones, traders can enter the market with reduced risk.
Assessing the Dominant Side
Analyzing the balance of Bid and Ask at trap levels provides insights into which side is controlling the market at the moment.
Building a Strategy
These levels offer clear entry and exit points based on the actions of major market participants.
Conclusion
Using delta analysis through the footprint allows traders to detect market traps, evaluate the dominant side, and make informed trading decisions, minimizing risks.


…


.
.
Section 3: Practical Application of the Footprint
Practical Use of the Footprint Chart
The footprint chart is not just a graphical representation; it is a powerful analytical tool that allows traders to delve deeper into market processes. Its value is revealed through practical applications: from analyzing accumulation and distribution zones to identifying manipulations and assessing the current market sentiment. This section will help you master approaches to working with the footprint chart, enhancing the accuracy of your trading decisions.
Accumulation and Distribution Zones
The footprint chart offers a unique opportunity to observe the actions of major market participants accumulating or offloading positions.
These zones are key to forecasting future market movements and provide traders with valuable insights.
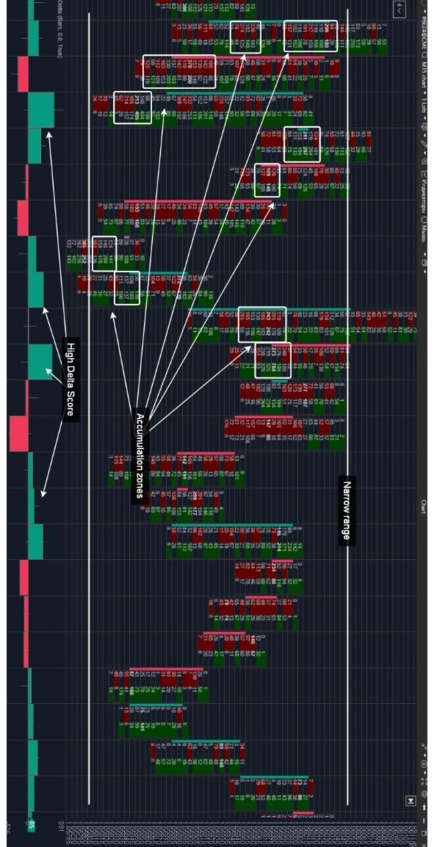
Accumulation Zones
What are Accumulation Zones
Accumulation zones form in areas where the price remains within a narrow range while trading volumes increase. This indicates active interaction between buyers (Ask) and sellers (Bid), building a foundation for future market movements.
Characteristics of Accumulation Zones:
– Consistent Bid and Ask activity at key levels, as visible on the chart.
– Prevalence of large trades within a narrow range, often accompanied by a neutral or positive delta.
– Repeated price returns to the same level, signaling consolidation.
Signs of Accumulation Zones:
– High Bid and Ask volumes at specific levels.
– Sustained price movement within a narrow range.
– Neutral or positive delta, indicating balanced forces between buyers and sellers.
Practical Application:
– Traders use accumulation zones to identify entry points. A breakout of these zones’ boundaries typically signals the start of a new trend.
– High-volume levels help identify support or resistance zones where momentum may begin.
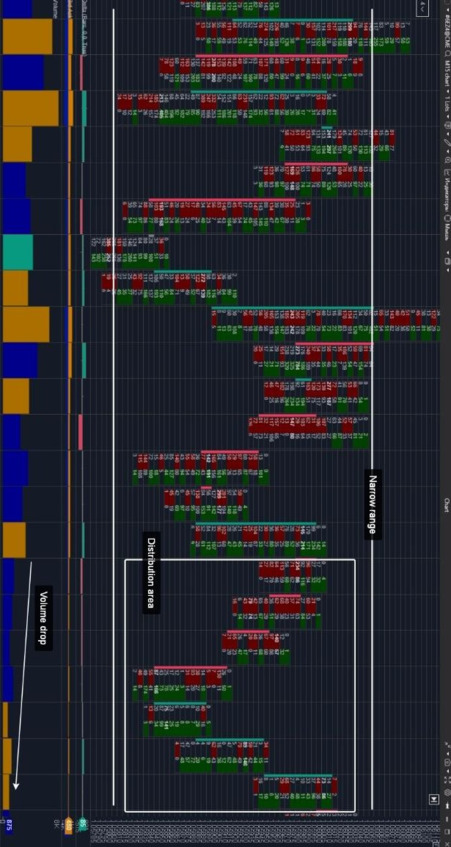
Distribution Zones
What are Distribution Zones
Distribution zones emerge when trading volumes begin to decline, and the price moves out of the previous range. This signals the completion of accumulation and the start of position offloading by major players.
Characteristics of Distribution Zones:
– Gradual decline in volumes following a period of high activity.
– Price movement begins in the direction of the breakout from the narrow range, forming a new trend.
– Often accompanied by a change in delta, indicating a shift in market participant sentiment.
Signs of Distribution Zones:
– Sharp decrease in volumes, signaling waning interest from market participants.
– Breakout of the horizontal range, indicating the end of consolidation.
– Negative delta or a sharp delta shift, confirming a change in participant sentiment.
Practical Application:
Trend Reversal Identification:
Distribution zones help identify moments when an upward or downward movement is coming to an end.
Exit Point Identification:
Declining volumes and delta shifts enable traders to select optimal points for closing positions.
Conclusions and Applications
The footprint chart is a tool that makes the hidden actions of the market visible. Analyzing accumulation and distribution zones allows traders to:
– Identify entry and exit points with reduced risk.
– Understand the actions of major participants and anticipate their influence on price.
– Use delta and volumes to assess market sentiment and identify key levels.
– The practical use of the footprint chart opens opportunities for more accurate and confident trading, helping traders avoid mistakes and minimize risks.
Identifying Manipulations
The Market as a Field of Manipulation
The market is an arena where every participant seeks to gain an advantage. Large players use manipulation as a tool to influence others’ behavior, creating false signals and provoking smaller traders into making mistakes. Footprint charts provide a glimpse behind the scenes of these manipulations, enabling traders to identify and leverage them for their benefit.
What are Manipulations
Manipulation refers to the deliberate distortion of market information to compel other participants into making disadvantageous decisions.
This may involve false price movements, price stalling, or artificially creating an illusion of demand or supply.
Main Types of Manipulations:
– False Moves: Creating an illusion of price intent to move in a certain direction.
– Price Stalling: Artificially stagnating the price at a level for covert accumulation or distribution of positions.
False MovesWhat Are False MovesFalse moves create an illusion of a market trend, prompting traders to open positions that later result in losses.Signs of False Moves:High volumes without significant price movement.For example, Ask or Bid volumes grow, but the price remains within a narrow range.Delta contradicting the price direction.If the price rises while delta remains negative (indicating selling dominance), it suggests a potential trap.Activity spikes in specific ranges.These spikes are often used to lure participants to the “wrong” side of the market.How to Trade It:– Don’t rush to open positions based solely on price movement.– Ensure the delta confirms the direction.– Wait for a breakout from the range with volume confirmation.Price StallingWhat Is Price StallingPrice stalling refers to a consolidation phase where large players accumulate or distribute positions while maintaining an appearance of market stability.Signs of Price Stalling:Repeated volumes at the same level.This signals covert activity by major players.Neutral delta.If delta remains balanced despite high volumes, it indicates artificial market stalling.Lack of significant price breakouts.The price repeatedly returns to the same level without breaking it.Why Is This Important– Large players use stalling to covertly prepare positions before a significant move.– After stalling ends, the market typically makes a sharp move in the “correct” direction.How to Trade It:– Analyze repeated volumes and neutral delta.Конец ознакомительного фрагмента.
Текст предоставлен ООО «Литрес».
Прочитайте эту книгу целиком, купив полную легальную версию на Литрес.
Безопасно оплатить книгу можно банковской картой Visa, MasterCard, Maestro, со счета мобильного телефона, с платежного терминала, в салоне МТС или Связной, через PayPal, WebMoney, Яндекс.Деньги, QIWI Кошелек, бонусными картами или другим удобным Вам способом.
Вы ознакомились с фрагментом книги.
Для бесплатного чтения открыта только часть текста.
Приобретайте полный текст книги у нашего партнера:
Полная версия книги
Всего 10 форматов