
Полная версия:
All sciences. №8, 2023. International Scientific Journal

All sciences. №8, 2023
International Scientific Journal
Authors: Aliyev Ibratjon Xatamovich, Maksudov Asatulla Urmanovich, Umaraliyev Nurmamat, Xakimov Murodjon Fozilovich, Abduraxmonov Sultonali Mukaramovich, Sayitov Shavkatjon Samiddinovich, Abdullayev Jamolitdin Solijonovich, Mavlyanov Aminjon, Jamoliddinov Javohir Iqboljonovich, Stultonov Shuxrat Davlatovich, Dadajonov Tulan
Editor-in-Chief Ibratjon Xatamovich Aliyev
Illustrator Ibratjon Xatamovich Aliyev
Illustrator Sultonali Mukaramovich Abduraxmonov
Illustrator Obbozjon Xatamovich Qo'ldashov
Cover design Ibratjon Xatamovich Aliyev
Cover design Ra'noxon Mukaramovna Aliyeva
Acting scientific supervisor Sultonali Mukaramovich Abduraxmonov
Economic manager Farruh Murodjonovich Sharofutdinov
Proofreader Gulnoza Muxtarovna Sobirova
Proofreader Abdurasul Abdusoliyevich Ergashev
© Ibratjon Xatamovich Aliyev, 2024
© Asatulla Urmanovich Maksudov, 2024
© Nurmamat Umaraliyev, 2024
© Murodjon Fozilovich Xakimov, 2024
© Sultonali Mukaramovich Abduraxmonov, 2024
© Shavkatjon Samiddinovich Sayitov, 2024
© Jamolitdin Solijonovich Abdullayev, 2024
© Aminjon Mavlyanov, 2024
© Javohir Iqboljonovich Jamoliddinov, 2024
© Shuxrat Davlatovich Stultonov, 2024
© Tulan Dadajonov, 2024
ISBN 978-5-0060-9088-0
Created with Ridero smart publishing system
PHYSICAL AND MATHEMATICAL SCIENCES
ON A BRIEF ANALYSIS AT A CERTAIN INTERVAL OF THE COLLATZ HYPOTHESIS
Aliyev Ibratjon Xatamovich
3rd year student of the Faculty of Mathematics and Computer Science of Fergana State University
Ferghana State University, Ferghana, Uzbekistan
Annotation. Modern research in the field of mathematics, including number theory, is developing quite actively, however, among a large number of very different mathematical models describing various natural phenomena, there are also those that are among the unsolved mathematical problems. Today we can refer to them the so-called Collatz hypothesis, the description of which is directed at the boundaries of this work.
Keywords: mathematics, research, physical and mathematical modeling, number theory, function.
Аннотация. Современные исследования в области математики, в том числе теории чисел развиваются достаточно активно, однако, среди большого количества самых различных математических моделей, описывающие различные явления природы существуют и те, которые находятся в ряду не решённых математических задач. К ним сегодня можно отнести так называемую гипотезу Коллатца, описанию на границах коих и направлена настоящая работа.
Ключевые слова: математика, исследование, физико-математическое моделирование, теория чисел, функция.
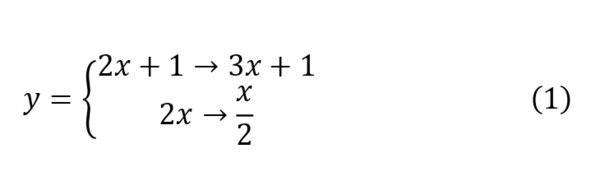
The Collatz hypothesis itself is one of the simplest unsolved problems known to date. It is a statement that let some natural number be taken and if it is not even, then it is multiplied by 3 and then one is added or, more precisely, the function 3x+1 is performed, if the number is even, then it is divided in half. Thus, it turns out the separated form of the function of the Collatz hypothesis (1).
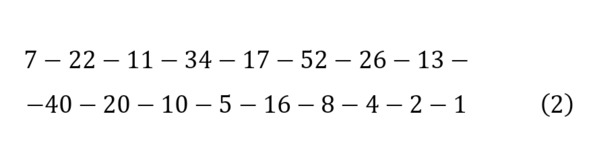
Further, the result obtained in (1) may be repeated. So, the present model can be defined for the number 7, which is not even and the first function is executed, it turns out 22 is an even number. Now the second function is executed and 11 is obtained, etc. In general, this series looks like this (2).
Now you can choose another number, for example 9 (3), 8 (4) or 6 (5).
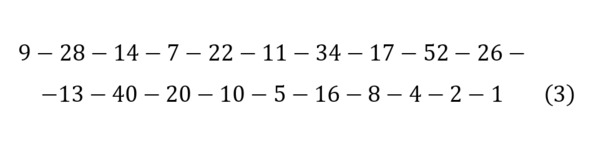
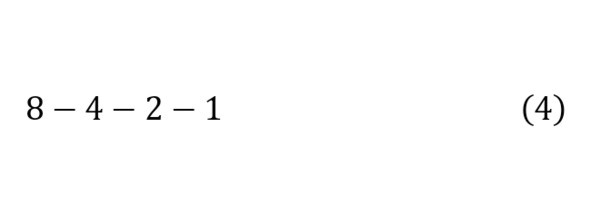
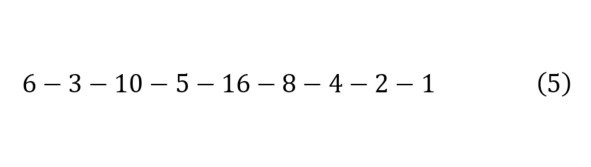
In all cases, one can observe the same pattern, that in the end a cycle of 4, 2, 1 is obtained, which will be repeated each time indefinitely. And the idea of the Collatz hypothesis is to prove that all natural numbers will lead to a real cycle. But it is noteworthy that the diagram of such a model has an interesting chaotic scheme with its maximum and minimum points. This scientific work is devoted to the analysis of changes in the graphs of the function of the Collatz hypothesis.
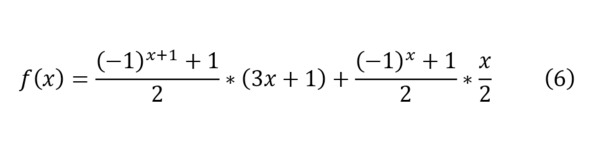
Initially, it is worth writing down the model of function (1) in general form (6).
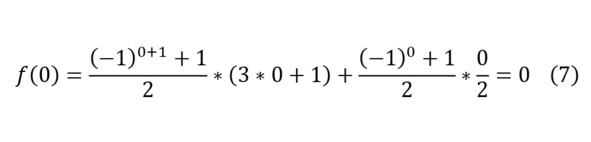
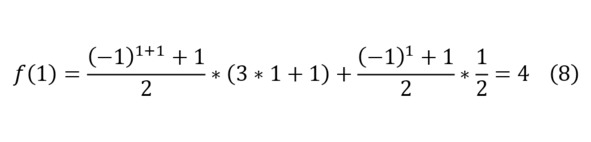
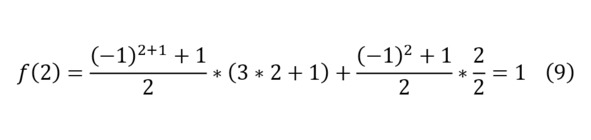
So, you can substitute some numbers to get suitable values for even and non-even numbers (8—9), however, before the study it is worth noting that the exception is the number zero, which contains the only cycle that differs from the cycles of all natural numbers, consisting of 2 elements (7).
For the general series of the function, we get the representation (10).
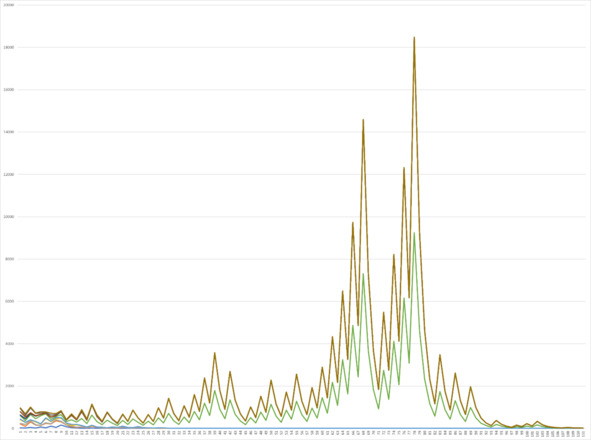
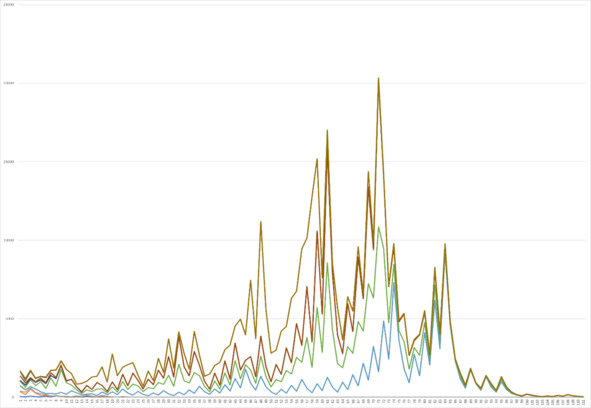
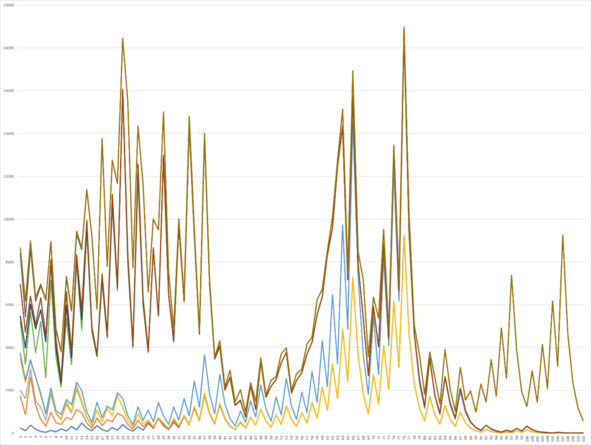
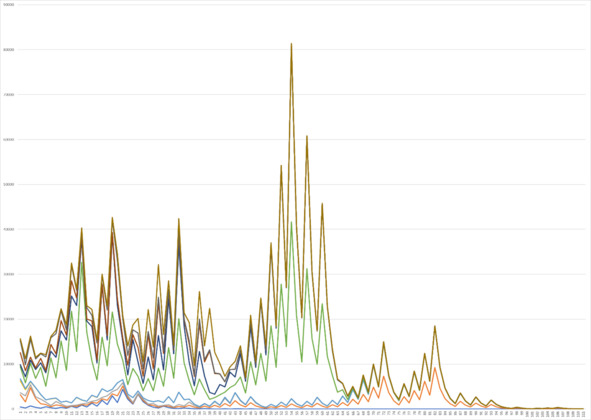
So, initially it is worth paying attention to the analysis carried out using 110 stages of repeated operation, and at this interval the initial peaks are clearly visible on the graph of the analysis of natural numbers in the range from 1 to 10 (Graph 1).
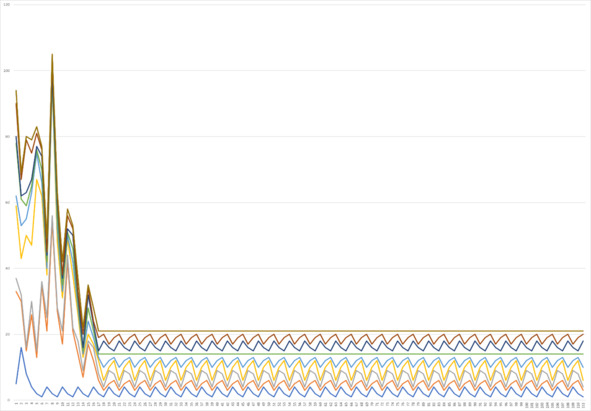
Graph 1. Functions for the interval [1; 10] for 110 elements
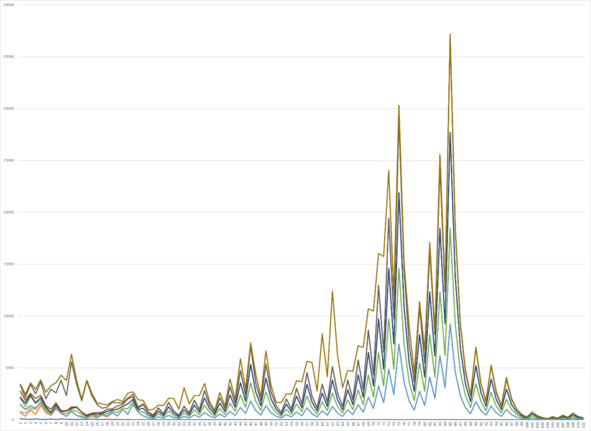
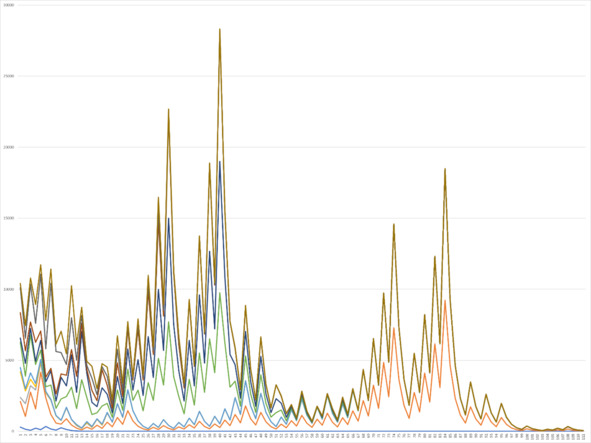
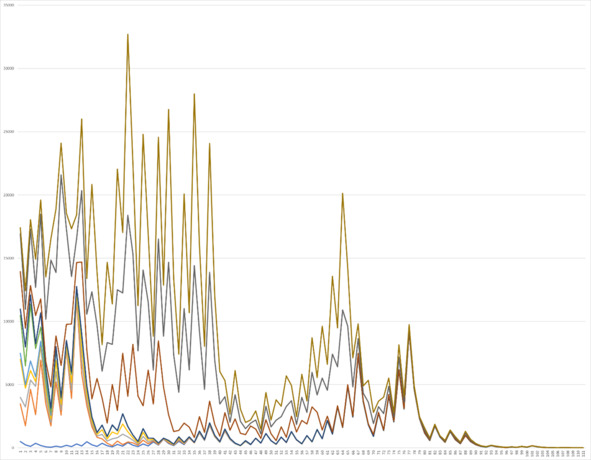
In this case, it will be possible to observe that with increasing numbers, individual peaks can be observed, the number of which begins to increase each time, becoming chaotic. Some values can already take large indicators of the function at their beginning, reaching a small number of stages, each time coming to a repeated cycle more and more, as can be seen in the continuation of the right part of each of the functions. Further, the analysis of the graph continues in the next interval from 10 to 20, an increase in the height of the peaks of the function can be observed, although the density of the location of each of the functions also increases. This can be seen more clearly when considering the continuation of the function in the right part – against the background of cycles, where the correlation becomes more and more obvious (Graph 2).
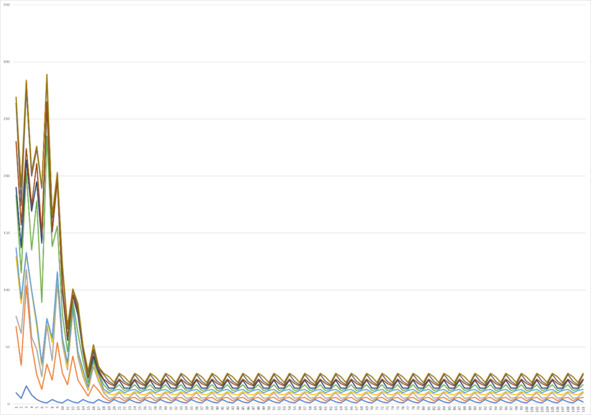
Graph 2. Functions for the interval [10; 20] for 110 elements
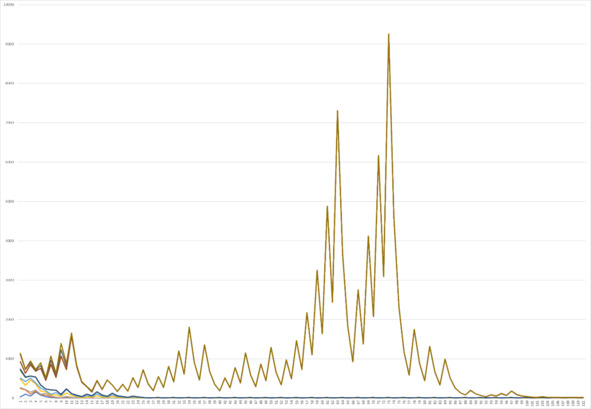
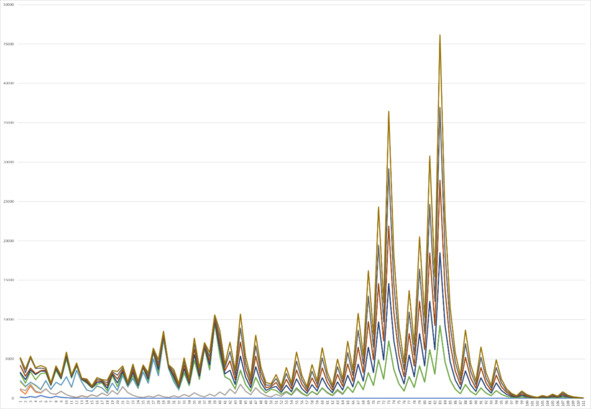
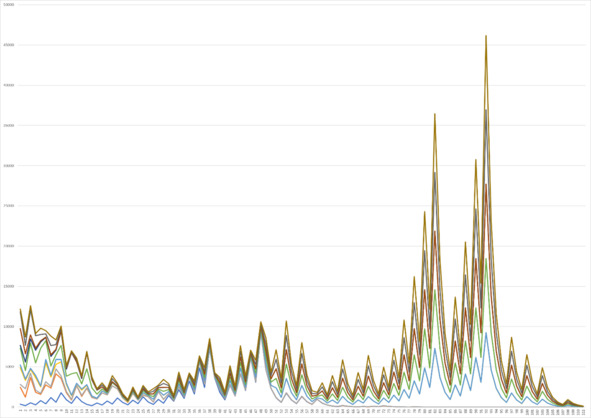
While continuing the analysis, you can pay attention to an interesting approach in that after 20 functions change and the level of superposition of each one on the other begins to increase more and more each time, leading to the fact that already when analyzing the number from 17 to 27, the correlation level becomes maximum. This can also be clearly seen in Graph 3, where at least some difference is observed only at the beginning of the graphs, and already closer to an increase in the number of operations, all functions are increasingly combined, resulting in small increasing peaks at first, which seem to alternate in increasing and decreasing. Further, this trend increases by one large increase, followed by smaller, but still increasing peaks, coming to two maximum large peaks, ending only with the final peaks, again returning to the form of the cycle, which is more like a straight line against the general background. In this case, it is worth paying more attention to that. That the growth of the graph relative to the central peaks occurs more smoothly than the decline, which surprisingly describes examples of real physical phenomena quite well when presenting their graphs.
Graph 3. Functions for the interval [17; 27] for 110 elements
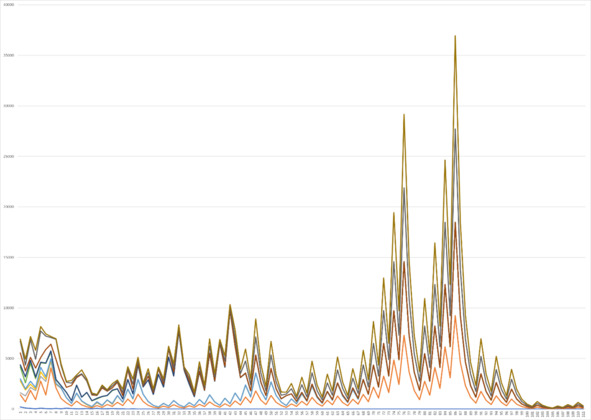
If we compare the values from 20 to 30, then we can see that the graph is preserved, but the level of coincidence of these graphs for 110 elements begins to decrease each time and what becomes even more noticeable when considering at the initial stages of the function, which was still noticeable in the previous graph, however, in this case this effect has intensified, although the overall completion of the graph has also been preserved, maintaining the same condition for approaching the level of reduction to the state of a straight line with fluctuations (Graph 4).
Graph 4. Functions for the interval [20; 30] for 110 elements
More significant changes, but at the same time a high level of coincidence is observed when considering the same large peaks of the graphs in the range from 30 to 40. At the same time, a decrease in correlation is observed at the moment of the initial state of the graph. However, another distinctive feature of the next level of the graph, unlike the previous one, is also the appearance of a straight line, the level of which is increasingly decreasing closer to an increase in the number of steps, the total number of elements of which continue to remain Graph. 5.
Graph 5. Functions for the interval [30; 40] for 110 elements
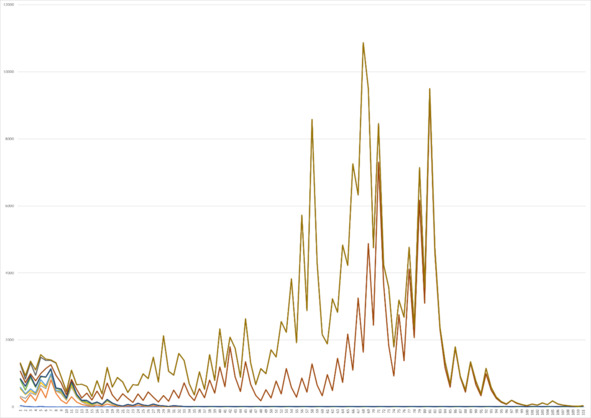
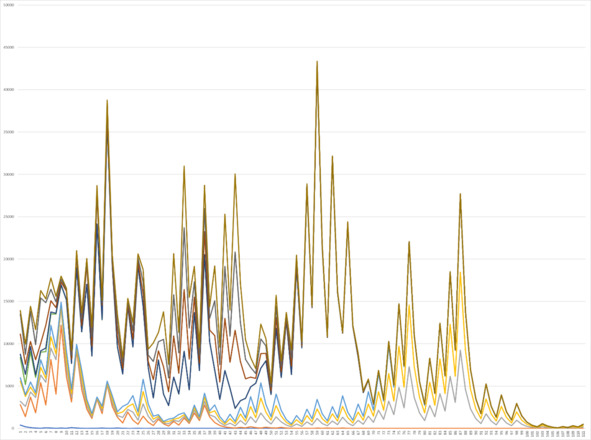
However, the tendency to preserve function matches is lost immediately in the next interval from 40 to 50 for the same 110 elements. In this case, the picture of the graph itself is already somewhat different. If we talk about its initial position, then indeed the differences in functions continue to increase somewhat, however, with increasing steps, we can observe a picture when the upper function begins to stand out, and other functions connect with other graphs forming an orange line. This time, the yellow upper function begins to increase distinctly, each time increasing by certain peaks, after which the graph falls off again, but quickly begins to gain growth again. This stage of growth is surprisingly quite interesting, because there is a double stage of doubling of peaks, after which the next small, but also doubled peak comes out, between each of which there is an increase, however, relatively small. Then this situation repeats again for the next maximum peaks, followed by a sharp and fairly rapid decline, after which the situation again reduces to a state of small increases until the overall picture decreases to standard small fluctuations in the cycle – a comparatively formed straight line. The second function in this case has a slightly different, more singular character due to the fact that correlation is observed for the first single peaks, followed by a faster decline at the end of Graph 6.
Graph 6. Functions for the interval [40; 50] for 110 elements
The picture described for the situation from 40 to 50 retains its specific role model for the subsequent graph for numbers from 50 to 60, which can be traced during its analysis, however, in this case, the role of the upper and lower maximum functions, of course, are already other values, which also carry a sharper increasing However, this, along with other things, can be traced during the analysis of the maximum and average initial peaks, after which there was a small drop, and after the maximum – a sharper one, as can be seen, with a large coincidence for the peaks on Graph 7.
Graph 7. Functions for the interval [50; 60] for 110 elements
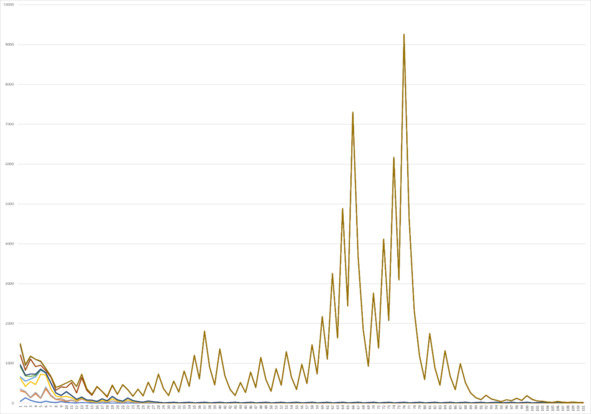
Thus, in the future, graphs are presented for the intervals from 60 to 70, where, surprisingly, a sharp increase in correlation can be observed again, when part of the functions goes down as a separate line, and one single one acts as the only upper correlating one (Graph. 8). In the future, the graph begins to change again for the interval from 70 to 80 and the state described in the early interval for the interval from 40 to 50, it will be possible to observe an increase in the number of peaks at the beginning to two classes, and in the center of three large maximum peaks, where you can observe a situation where the main plan describes the main yellow function, correlation with which it increases for the red function at the third peak and with a small second central right peak, from where it is possible to trace the similarity of the pictures, but with a noticeable shift in Graph 9.
Graph 8. Functions for the interval [60; 70] for 110 elements
Graph 9. Functions for the interval [70; 80] for 110 elements
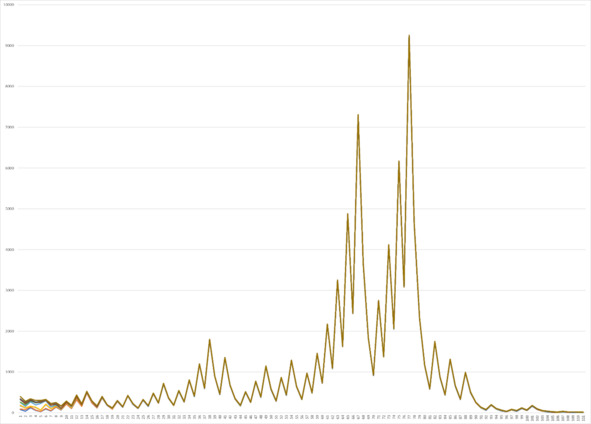
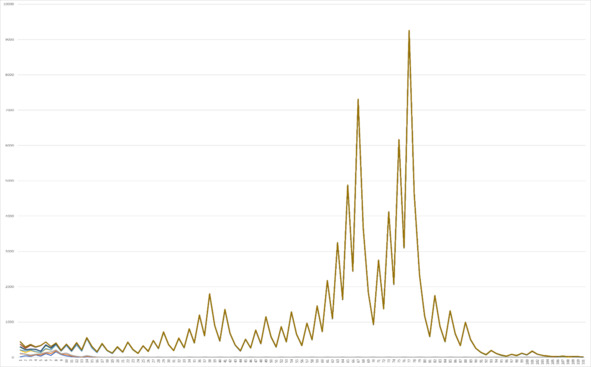
The continuation of the study allows us to observe the similarity of the interval from 17 to 27, from 20 to 30, from 60 to 70 and from 80 to 90, without small distinguishing features, as can be seen in Graph 10. And the situation for the interval from 90 to 100 is one of the most beautiful images, because here almost every graph is not like another, although most of them retain their definite trend, as can be seen in Graph 11. After that, the interval from 190 to 200 takes a more ordered, beautifully shaped form, where most of the functions take their general, uniform form, however, with a different level of bias with a decrease in the degree of correlation for each of them (Graph. 12).
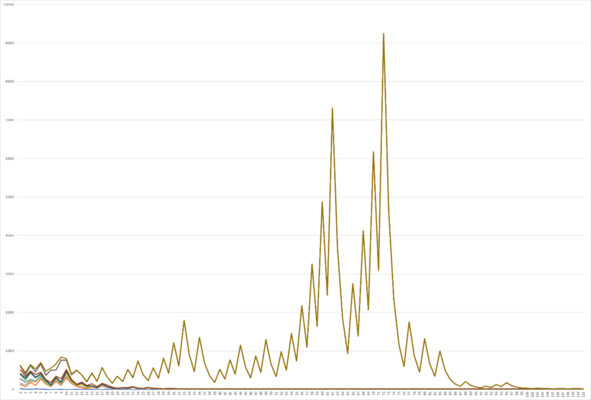
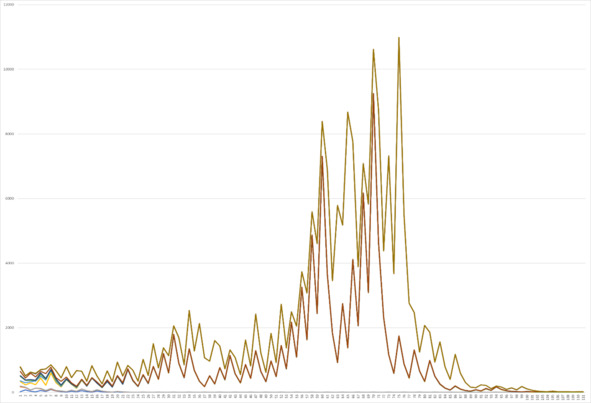
This difference begins to decrease when analyzing Graph 13 for numbers from 290 to 300, where you can pay attention to an already more clearly verified and rather beautiful picture. This aspect is already beginning to change, leading to an increase in the degree of differing properties between functions from 390 to 400, as can be seen in Graph 14. The subsequent increase in the degree of gaps leads to the continuation of such a trend, which is clearly seen in a cardinal difference with the formation of a real house in the range from 490 to 500, so that even when most functions have already reached the final form, some functions begin to continue to increase forming massive peak forms (Graph. 15).
The continuation of the growth of the boundaries leads to a further increase, so the initial shape of the graph begins with a sharp increase, then decreases, and then continues at maximum peaks, which has never been repeated before, given that the graphs decline further and then sharply increase again to two peaks (Graph. 16). Further, the situation with a small difference continues at the moment from 690 to 700, while having a sharp shift of large peaks, having an elongation in the initial difference and the range of the initial small class of peaks (Graph. 17). And it would seem that the correlation situation can be increased, however, according to the graphs for values from 790 to 800, from 890 to 900, from 990 to 100, they retain the form of a house (Graph 18—20).
Graph 10. Functions for the interval [80; 90] for 110 elements
Graph 11. Functions for the interval [90; 100] for 110 elements
Graph 12. Functions for the interval [190; 200] for 110 elements
Graph 13. Functions for the interval [290; 300] for 110 elements
Graph 14. Functions for the interval [390; 400] for 110 elements
Graph 15. Functions for the interval [490; 500] for 110 elements
Graph 16. Functions for the interval [590; 600] for 110 elements
Graph 17. Functions for the interval [690; 700] for 110 elements
Graph 18. Functions for the interval [790; 800] for 110 elements
Graph 19. Functions for the interval [890; 900] for 110 elements
Schedule 20. Functions for the interval [990; 1000] for 110 elements
As a result of the analysis, it was possible to clearly see the change in the patterns of graphs for a variety of intervals when testing the Collatz hypothesis, each of which has its own importance, finding its application in a variety of fields. And today we can hope to find in the future the possibility of solving this problem in the face of proof of this hypothesis, or its refutation.
Used literature
1. Hayes Brian. The ups and downs of hailstone numbers // In the World of Science (Scientific American, Russian edition). – 1984. – No. 3. – pp. 102—107.
2. Stuart Ian. The greatest mathematical problems. – M.: Alpina non-fiction, 2015. – 460 p. – ISBN 978-5-91671-318-3.
3. Jeff Lagarias. The 3x+1 problem and its generalization // American Mathematical Monthly. – 1985. – Vol. 92 – P. 3—23.
4. Alfutova, N. B. Algebra and number theory. Collection of problems for mathematical schools / N. B. Alfutova, A.V. Ustinova. – M.: ICNMO, 2018. – 336 p.
5. Alpatova, N. B. Algebra and number theory: Collection of problems for mathematical schools / N. Alfutova B., And A. V. Ustinov. – M.: mtsnmo, 2009. – 336 c.
6. Arnold, V. I. the Theory of numbers by I. V. Arnold. – M.: Lenand, 2019. – 288 c.
7. Borevich, Z. I. number Theory / zi Borevich, I. R. Shafarevich. – M.: Lenand, 2019. – 504 c.
8. Boss, W. Lectures on mathematics: Theory of numbers / V. Boss. – M.: Lenand, 2014. – 224 p.
9. Boss, V. Lectures on Mathematics vol.14: Theory of numbers / V. Boss. – M.: CD Librocom, 2010. – 216 p.
10. Boss, V. Lectures on mathematics: Theory of numbers / V. Boss. – M.: Lenand, 2017. – 224 p.
11. Boss, V. Lectures on mathematics: Theory of numbers / V. Boss. – M.: Lenand, 2019. – 224 p.
12. Bukhstab, A. A. Number theory: A textbook / A. A. Bukhstab. – St. Petersburg: Lan, 2015. – 384 p.
13. Weil, G. Algebraic theory of numbers / G. Weil. – M.: URSS, 2011. – 224 p.
14. Gankel, G. The theory of complex numerical systems, mainly ordinary imaginary numbers and Hamilton quaternions together with their geometric interpretation. Trans. from German / G. Gankel. – M.: Lenand, 2015. – 264 p.
15. Gankel, G. The theory of complex numerical systems, mainly ordinary imaginary numbers and Hamilton quaternions together with their geometric interpretation / G. Gankel. – M.: Lenand, 2015. – 264 p.
16. Egorov, V. V. Theory of numbers: A textbook / V. V. Egorov. – St. Petersburg: Lan, 2015. – 384 p.
17. Zolotarev, E. I. Theory of integral complex numbers with an application to integral calculus / E. I. Zolotarev. – M.: Lenand, 2016. – 216 p.
18. Ivanets, H. Analytical theory of numbers / H. Ivanets. – M.: ICNMO, 2014. – 712 p.
19. Krasnov, M. L. All higher mathematics: Discrete mathematics (number theory, general algebra, combinatorics, Poya theory, graph theory, pairs, matroids) / M. L. Krasnov, A. I. Kiselev, G. I. Makarenko. – M.: KomKniga, 2014. – 208 p.
20. Ozhigova, E. P. What is the theory of numbers / E. P. Ozhigova. – M.: Editorial URSS, 2010. – 176 p.
21. Ostrik, V. V. Algebraic geometry and number theory. Rational and elliptic curves / V. V. Ostrik. – M.: ICNMO, 2011. – 48 p.
22. Ostrik, V. V. Algebraic geometry and number theory: rational and elliptic curves / V. V. Ostrik, M.A. Tsfasman. – M.: ICNMO, 2005. – 48 p.
23. Petrov, N. N. Mathematical games: Joke games. Symmetry. Games “Him”. The game “Jianshizi”. Games with polynomials. Games and number theory. Analysis from the end. Winning strategies / N. N. Petrov. – M.: Lenand, 2017. – 208 p.
24. Rybnikov, K. A. History of mathematics: Interdisciplinary presentation: Geometry. Algebra and number theory. Mathematical analysis. Probability theory and mathematical statistics. Discrete Mathematics / K. A. Rybnikov. – M.: Lenand, 2018. – 536 p.
25. Serovaisky, S. Ya. History of Mathematics: Evolution of mathematical ideas: Number Theory. Geometry. Topology / S. Ya. Serovaisky. – M.: Lenand, 2019. – 224 p.
26. Sushkevich, A. K. Theory of numbers / A. K. Sushkevich. – M.: University book, 2016. – 240 p.
27. Sushkevich, A. K. Number theory. Elementary course / A. K. Sushkevich. – M.: University book, 2007. – 240 p.
ABOUT MODERN RESEARCH IN THE FIELD OF IMPROVING THE TECHNOLOGY OF ELECTRONIC TUNNELING
Aliyev Ibratjon Xatamovich
3rd year student of the Faculty of Mathematics and Computer Science of Fergana State University
Ferghana State University, Ferghana, Uzbekistan
Annotation. This article discusses the theoretical foundations and mathematical apparatus of a new method of transmitting information at high speeds, in contrast to the classical electromagnetic method, the method of using quantum entanglement and other similar recognized methods. The technological improvement of information transmission methods today really deserves attention, since they become a sufficient reason for a new revision of new achievements in this field. One of such technologies, currently developing mainly in a theoretical way, is the method of using the electronic tunnel effect. Now becoming more and more relevant.
Keywords: quantum tunneling effect, electrons, information transfer, theoretical foundations, physical and mathematical apparatus.
Аннотация. В настоящей статьи рассматриваются теоретические основы и математический аппарат нового метода передачи информации на больших скоростях, в отличие от классического электромагнитного метода, метода использования квантовой запутанности и прочих подобных признанных методом. Технологическое совершенствования методов передачи информации сегодня действительно заслуживает внимания, поскольку становятся достаточной причиной для нового пересмотра новых достижений в настоящей области. Одной из таких технологий, ныне развивающаяся в основном в теоретическом ключе является метод использования электронного туннельного эффекта. Ныне становящийся всё более актуальным.
Ключевые слова: квантовый туннельный эффект, электроны, передача информации, теоретические основы, физико-математический аппарат.
The phenomenon of the quantum tunneling effect is quite well-known and popular today. This effect itself is based on the fact that microparticles can overcome a certain potential barrier if its total energy, which remains unchanged and is not spent on overcoming the barrier, is less than the height of the barrier itself. Of course, such a phenomenon by definition could not occur on the scale of classical physics, at least because of its vivid contradiction, however, this effect itself is proven by numerous empirical results, since it underlies the most diverse phenomena of atomic, molecular physics, physics of the atomic nucleus and elementary particles, solid state and others.