

Полная версия:
English Original Reader for Technical Students. Power transformers: short-circuit testing, monitoring systems (Smart Grid)

Александр Хренников
English Original Reader for Technical Students. Power transformers: short-circuit testing, monitoring systems (Smart Grid)
This book is dedicated to the memory of my father Khrennikov Yurij Alexandrovich
This book is dedicated to the memory of my father Khrennikov Yurij Alexandrovich.
He was an Electrical Engineer and took part in the building of seven hydroelectric power stations.
Abbreviations
IMS-Information-measuring systems;
LVI–Low Voltage Impulse;
FRA-Frequency Response Analysis;
T-controlled power transformer;
TV-voltage transformer;
CT-current transformer;
B-high-voltage circuit breaker;
L-inductance;
ANR-accidental and non-regime;
RW-regulation winding;
DGA-Dissolved Gas Analysis;
ADC-analog-to-digital converters;
RMSD-root-mean-square deviation;
AFC-amplitude-frequency characteristic;
HV-high voltage (winding);
LV1-first low voltage (winding);
LV2-second low voltage (winding);
MV-medium voltage (winding);
HEPS-Heat Electric Power Station;
µsec-microsecond;
JSC “FGC UES”-Joint Stock Company “Federal Grid Company of
Unified Energy System”;
STL-Short-current Testing Laboratory;
SREPS-State Regional Electric Power Station;
IR-control-infra-red control;
PD-partial discharges;
TG-turbo-generator;
DC-direct current
DO-digital oscillograph;
GIS-gas insulated switchgear;
SAWP-specialized automated working place;
TCS-technical condition state;
IEPS AAN-Intellectual electric power system with the active-
adaptive network;
M&R-maintenance and repair;
EMF-electromotive force;
OA-operational amplifier;
EDS-expert- diagnostic system;
TREE-transformer and reactor electrical equipment;
ETCS-electrotechnical complexes and systems;
DM-diagnostic models;
DF-diagnostic feature;
ED- electrical device;
OFA-operational physical actions;
EMC-electromagnetic compatibility;
Chapter 1. Monitoring Systems (Smart Grid) and Diagnostics Electrical Equipment Faults
Abstract
The most important elements of “intellectual networks” (Smart Grid) are the systems of monitoring the parameters of electrical equipment. Information-measuring systems (IMS), which are described in this paper, were proposed to be used together with rapid digital protection against short-circuit regimes in transformer windings. This paper presents the experience of LVI-testing application, some results of using Frequency Response Analysis (FRA) to check conditions of transformer windings and infra-red control results of the electrical equipment. The LVI method and short-circuit inductive reactance measurements are quite sensitive to be able to detect such faults as radial and axial winding deformations, twisting of low-voltage or regulating winding, losing of winding pressing, and others.
Keywords: Intellectual Networks; Smart Grid; Monitoring System; Electrical Equipment; Information-Measuring System; Frequency Response Analysis; Transformer Winding Fault Diagnostic; Low Voltage Impulse Method; Short-Circuit Inductive Reactance Measurement
1.1. Introduction
Joint Stock Company “Federal Grid Company of Unified Energy System” is the operator of the United National Electrical Network of Russia. The total extent of electrical power transmission lines is 121.7 thousand km, the number of substations is 805, and the class of voltage is 220–750 kV. The five-year investment program includes the construction of 73 new substations.
The switch to “clever power engineering” (Smart Grid) realized by Federal Grid Company, will make it possible not only substantially change today’s energy landscape, but also further develop the electrotechnical industry, mastering new technologies and creating new electrical equipment. Novel methods are to be incorporated both in plants and in scientific design institutes, stimulating the professional growth of Russian scientists.
In Saint-Petersburg International Economic Forum that took place some years ago, it was declared that one of the results of the conversions, conducted today by Federal Grid Company, must be the creation of the components of “intellectual networks” (Smart Grid), which will solve the existing tasks of the power electrical engineering providing for increase of effectiveness of its work and creating conditions for increasing the competitive ability of the economy of Russia on the basis of new innovation solutions and technologies.
1.2. Smart Grid Information-Measuring System for Control of Inductance Value Transformer’s Winding
The most important elements of “intellectual networks” (Smart Grid) are the systems of monitoring of the parameters of the electrical equipment. The residual winding’s deformations of power transformers during short circuits appear practically instantly, not leaving time to analysis of the results of diagnostic measurements, demanding to switch off the transformer as fast as possible in order to avert or, at least, reduce the necessary consequent repair of the electrical equipment.
Information-measuring systems (IMS), which are described in this paper, were proposed to transformer winding control. Rapid digital protection against short-circuit regimes in transformer windings is used with IMS. The instantaneous and average values of inductance have been calculated. This calculation showed that using IMS for inductance control allows to decrease the number of failures and expenditures for repair.
Scheme of using IMS for the control of transformer’s winding state avoiding disconnecting from the network is depicted in Figure 1 [by 1–4].
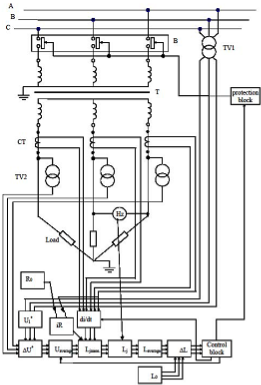
Figure 1. Information-measuring system for control of transformer’s windings state in service.
1.3. Algorithm of Smart Grid Information-Measuring System (IMS)
The algorithm of IMS’s work is the following. The continuous control of the winding’s state of the controlled power transformer is ensured by a constant monitoring of deviation of inductance value from the base value of inductance, which is obtained from the block of the base inductance.
During the work of the three-phase controlled power transformer (T) for the three-phase resistive load (Load) the value of primary voltage U1 is obtained by measuring converters primary voltage (high-voltage transformers TV1).
Signal from the converters was input to the entrance of the block which brings the primary voltage to the second one. In this block the value of the primary voltage, which is corrected to the second, is calculated:
Signal from the converters was entered to the entrance of the block of bringing the primary voltage to the second. In this block the value of the primary voltage, which is corrected to the second, is calculated:

where: Kt is the known given value of the transformation ratio of the power transformer.
Signals from the measuring converters of second voltage (voltage transformers TV2) and signals from the output of the previous block are input to the entrance.
In the block of calculation of voltage difference, which is corrected to the second side, we determine
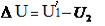
where: U2 is the value of second voltage, measured by converters TV2.
The calculations are performed in the assigned time interval in the block of calculation of voltage’s average value:
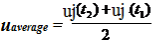
where: uj is the difference between corrected to the second side voltages on the transformer;
t1 and t2 are the temporary boundaries of the partition interval.
In the block of calculation of the current derivation the increase of the current in the assigned time interval is calculated:
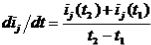
Here ij is the value of current in the secondary winding of the controlled transformer, measured by current converters (current transformers CT).
In the block of calculation of inductance, the instantaneous value of inductance is determined in the assigned time interval:
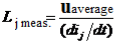
where: uaverage is the average value of voltage,
dij/dt is the value of current derivation.
Expression (1.5) can be obtained from Ohm's law for the magnetic circuit:

Further using the expressions below
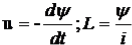
we obtain
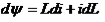
Disregarding the second term (assuming L = const), and assuming the linear characteristic of the medium, we have

which is analogous to (1.5).
In the block of bringing the value of inductance to the nominal frequency the instantaneous value of inductance corrected to the nominal frequency is calculated:

where: fmeas is the value of the frequency (Hz) measured by frequency converter,
fnom. is the nominal value of the frequency.
Lj meas. is the instantaneous value of inductance.
In the following block the average value of inductance during each period is calculated:
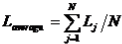
In the block of calculation of deviation, Laverage value during the period is compared with the base L0 value, and their difference is calculated:
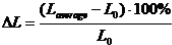
where: L average is the average value of inductance during the period;
L0 is the base value of transformer inductance, determined from the preliminary experiment.
When winding deformations begin or in the case of winding turn-to-turn internal short-circuit, the value of inductance L tends to increase, or to decrease from one time period to the next period in case of irreversible destruction of the controlled power transformer windings.
Then, the signal from the control block enters the protection block (rapid digital protection), where a signal to switch off is formed in the high-voltage circuit breaker (B). After that Information-measuring system and the connected with it protection block stop the process of winding destruction [by 1–4].
This Smart Grid monitoring system is a perspective direction of diagnostics under operating voltage.
1.4. Inductance Calculations of 167 MVA/ 500/220 kV Autotransformer
Basing on the foregoing, the algorithm (1.1–1.11) was developed and now constitutes a special program for calculating instantaneous inductance L during electrodynamic test of the power transformer by short-circuit currents. The program allows determining the average value of the inductance during each period. This value is more significant in the case of damage to the coil (primary deformation, coil circuit). To evaluate the potential effectiveness of the monitoring system, the calculations of instantaneous and average values of inductance (L) were performed for the case of accidental and non-regime (ANR) due to damage during short-circuit testing at Power Testing Laboratory (Togliatti) of 167 MVA/ 500/220 kV autotransformer.
During short-circuit testing of 167 MVA/ 500/220 kV autotransformer at the second short-circuit shot, i.e., experience with 100 % value of the short-circuit current 0.2 sec duration according to the test program (time set by the conditions of experience – 10 periods of current, and regulated by high voltage thyristor valves), there has been actuation of transformer gas protection.
Audit and inspection with the lifting of transformer tank and inspection of the active part of autotransformer have revealed the presence of electrical damage to the regulation winding (RW) – turn-to-turn short circuit. Figure 2 shows the real oscillograms of short-circuit current (Figure 2a), voltage (Figure 2b), estimated the average curve of inductance for 10 periods (Figure 2c), the calculated curve instantaneous inductance (Figure 2d) in the second short-circuit shot. Change of the value of the inductance of the curves in Figure 2 shows that the electric damage of RW winding happened at the 4th period and continued to develop in the remaining periods of short-circuit shot.
Calculations of inductance values show that the application of Smart Grid monitoring system and quick-working protection would submit a command to turn off the high-voltage circuit breaker in the fourth period of current that is, taking into account the work of protection and circuit breaker (at least three periods, i.e., 0.06 seconds), cease the emergency process at the 7-th period of current. Thus one could reduce the damage of RW windings and the cost of its repair at the transformer manufacturer.
a)
b)
c) and d) Figure 2. Oscillograms of short-circuit current (Figure 2a), voltage (Figure 2b), estimated the average curve of inductance for 10 periods (Figure 2c), the calculated curve instantaneous inductance (Figure 2d) in the second short-circuit shot of 167 MVA/ 500/220 kV autotransformer.
1.5. Smart Grid Monitoring System for Short-Circuit Testing
Smart Grid Monitoring System for control of parameters of the transformer when tested for withstands to short-circuit currents, part of the quick-working protection, is discussed in [by 1–3].
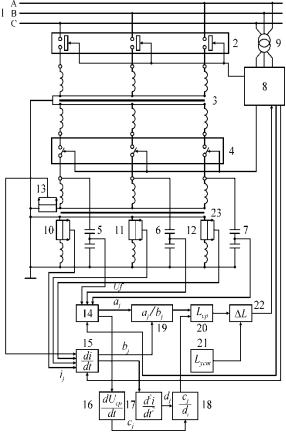
Figure 3. Smart Grid Monitoring System for control of transformer parameters during short-circuit testing, which is a part of the quick-working protection. 1-power supply (network), 2-safety high-voltage circuit breaker, 3-test transformer, 4-synchronous short-circuiter, 5–7-capacitive voltage dividers, 8–9, the control block, 9 – voltage transformer, 10–12-current-measurement shunts, 14–22-the functional blocks of the inductance average value’s calculation of the deviation from the original value, 23-testing transformer in the secondary winding short-circuit mode.
Control of the average value of inductance Laverage for the period during the test allows fixing moment of the beginning of the emergency regime and reducing the scale of the accident if the tested transformer is timely disconnected. The Monitoring System provides a more accurate measurement of inductance and increases the reliability of the power transformer in case of dangerous deformations.
Quick-working protection prevents accidental destruction of the test object and increases the crash safety of the test (Figure 3) [by 1–5].
In Figure 3 the following details of the equipment are shown: 1-power supply (network), 2-safety high-voltage circuit breaker, 3-test transformer, 4-synchronous short-circuiter, 5–7-capacitive voltage dividers, 8–9, the control block, 9 – voltage transformer, 10–12-current-measurement shunts, 14–22-the functional blocks of the inductance average value’s calculation of the deviation from the original value, 23-testing transformer in the secondary winding short-circuit mode [1–5].
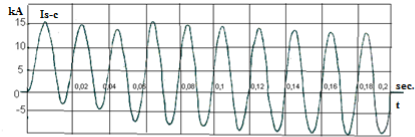
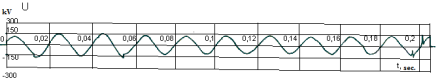
Consider the work of the monitoring system in Figure 3 with an example of the 400 MVA/220 kV transformer testing. Current and voltage oscillograms at the second short-circuit shot on the phase «C» of the 400 MVA/220 kV transformer are shown in Figure 4.
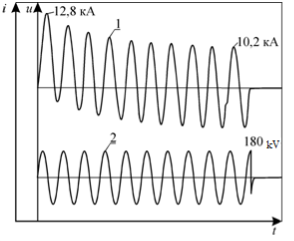
Figure 4. Current oscillogram (1) and voltage oscillogram (2) in the second short-circuit shot on the phase «C» of the 400 MVA/220 kV transformer.
Current oscillogram analysis shows that the value of aperiodical (shock) component of short-circuit current at the beginning of the short-circuit shot amounted to 12.8 kA, and through 10 periods after attenuation of aperiodical (shock) component at the end of the shot, then periodic component is only 10.2 kA.
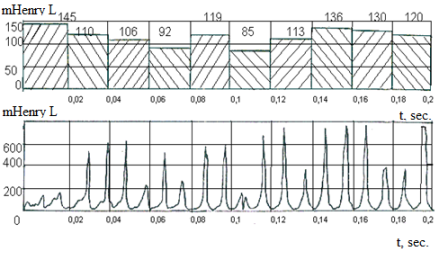
The calculated curve derivative from current and calculated inductance Ls-c curve of 400 MVA/220 kV transformer in the short-circuit shot on the phase «C» with 100 % of the value of the aperiodical (shock) short-circuit current are shown in Figure 5. Deviation of Ls-c amounted to +1.3 % in the short-circuit shot.
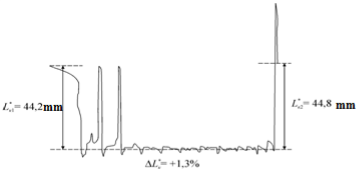
Figure 5. The calculated curve in the short-circuit shot on the phase «C» with 100 % of the value of the aperiodical (shock) short-circuit current of 400 MVA/220 kV transformer: a) derivative from current; b) calculated inductance Ls-c curve.
During the tests for withstands to short-circuit currents of 400 MVA/220 kV transformer, the following data were obtained:
values of voltage and current in short circuit shots,
the short-circuit inductance measurement results,
level of vibration in the short circuit shot,
LVI-testing data,
the results of chromatographic analysis of transformer oil dissolved gas (DGA).
Diagnostic data parameters allowed to complete the objective picture of the condition stste of 400 MVA/220 kV transformer during the tests for withstands to short-circuit currents [by 1–4].
1.6. An Accuracy of Diagnostic Parameter of Smart Grid Monitoring System
When Smart Grid Monitoring System is working, an important issue is the accuracy of main diagnostic parameter which characterizing the normal operation of power transformer – the short-circuit inductance of the windings. Large error during the measurement of this parameter can lead to malfunctions of the device: false outages or, on the contrary, the protection isn’t working when the inductance changed after the transformer or the reactor had been damaged. Therefore, it is proposed to introduce to the scheme of this device the block of the mathematical treatment of ΔL measurement.
The confidence interval of a random measurement error of transformer inductance was determined in the block of mathematical treatment of

Measured parameters I, U, P, F from the measured voltage transformers, capacitive voltage dividers, current-measurement shunts and frequency counter are input to the entrance of mathematical treatment block of measurement results, where at the entrance there are analog-to-digital converters (ADC), within which the following operations are performed by a special algorithm:
1) The value of short-circuit transformer inductance which is converted to a frequency 50 Hz, is calculated
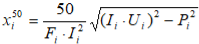
Where Ii, Ui, Pi, Fi are the values of current, voltage, power and frequency which are measured by ADC during i- count.
2) The average value of short-circuit transformer inductance at the 50 Hertz frequency is calculated
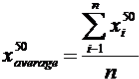
together with the total average value, including the parameters of the I, U, P, F:
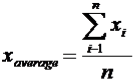
where: Xi – values of the I, U, P, F, measured by ADC during i-counting,
n is the number of measurements.
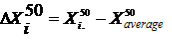
3) The deviation of short-circuit inductance is calculated
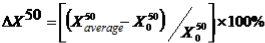
where:X0 – base value of short-circuit transformer inductance, determined by calculations according to the results of preliminary tests.
4) The root-mean-square deviation (RMSD) of the measurement results for each of the primary parameters of I, U, P, F is calculated;
5) The RMSD for the resultant of short-circuit inductance is calculated:
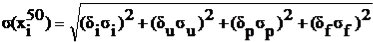
where:


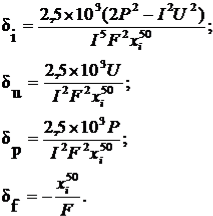
where: I, U, P, F are the primary measured parameters of the current, voltage, power and frequency.
6) The value of the fourth central moment of distributing the random error of measurement of inductance X50 is calculated:
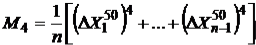
where n is number of measurements;
Xi50 is the value of short-circuit inductance;
Xaverage50 is the average value of short-circuit inductance;
7) The value of antikurtosis


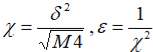
where:

M4 is the value of the fourth central moment of distribution from (1.18).
8) The value of an entropy error of measurement is calculated:
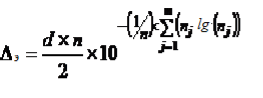
where: n is the number of measurements;
d is the width of the interval of the histogram of distribution definition as:
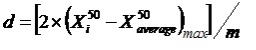
where: Xi50 and Xaverage50 are the values from (1.12–1.14), moreover the maximum significance of a deviation between them is taken;
m is the optimum number of class intervals of columns for constructing the histogram of distribution law of the random error:
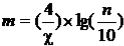
where

n is the number of measurements;
nj is the number of counting in j column of the histogram (j = 1…., m).
9) Determined by d – width of the interval of the histogram of distribution by (1.21);
10) Determined by m – optimum number of class intervals of columns for constructing the histogram of distribution law of the random error on (1.22);
11) Calculated value of the entropy coefficient of random error’s distribution of measurement: