скачать книгу бесплатно
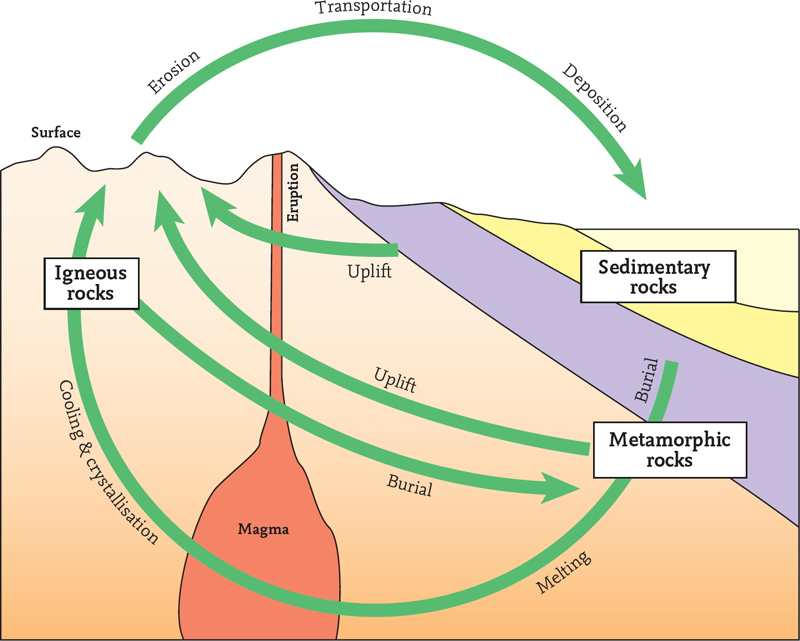
The Lewisian Complex consists of metamorphic rocks (typically coarsely crystalline gneisses) that formed by alteration of earlier rocks when high temperatures and/or pressures peaked during movements at deep levels within the Earth’s crust. The great interest of these metamorphic rocks is that they can provide information about the conditions deep within the crust when these movements were taking place. Unlike igneous rocks that formed by crystallisation from completely melted rock material, metamorphic rocks have involved changes in rocks that were at least partly solid, so they preserve information about features present before, as well as conditions during, the metamorphism. In most cases, the minerals now present are stable at present-day surface temperatures and pressures, are large in crystal size, and interlock with neighbouring crystals, so the rocks are resistant to surface weathering compared with many other rock types.
FIG 20. The five terranes of Scotland. (After Trewin 2002)
FIG 21. Episodes in Scotland’s geological history. The age scale is not linear and has been deliberately chosen so that younger episodes are given greater space than older ones, because they are usually known in greater detail. The chart indicates the ages covered by the 12 episodes, and the dominant processes represented by them. (Redrawn from International Stratigraphy Chart 2009, www.stratigraphy.org)
One of the most important research tools applied to the Lewisian rocks has been the dating of the various mineral components, using the fact that some of them contain radioactive materials that have been steadily changing since they were first trapped when the minerals formed. The amount of change gives a measure of the time over which it has been taking place. New analytical methods have led to increasingly accurate and reliable figures. As this work has continued, it has become clear that the Lewisian is truly a ‘complex’, made up of many distinct volumes of crust, each preserving certain episodes of movement and rock alteration. Many of the folds or fractures mapped in the Lewisian have a northwest/southeast trend, almost at right angles to the Moine Thrust Zone and the associated folds and fractures that form the margin of the Hebridean terrane. However, mapping of these structures has shown that the movement and alteration of the Lewisian occurred in a number of phases with different compression and shearing directions. The evidence is too fragmentary to allow identification of the boundaries of tectonic plates similar to those that can be identified in younger bedrock areas. This is hardly surprising, because these are some of the earliest movement events recognised anywhere on the surface of the whole Earth, representing glimpses of early crustal activity that has escaped reworking or obliteration in more recent episodes.
Important phases of activity and mineral alteration have been recognised in the Lewisian Complex, some in the Archaean (3.2 and 2.8 billion years ago), generally named Scourian and Inverian. Other rocks were formed and/or altered in the Proterozoic (2.4, 1.7 and 1.1 billion years ago) and are named Laxfordian. The Archaean phases are older than any other for which there is evidence in Britain. Most of the rocks altered in these phases were originally igneous but some were sedimentary, and all had actually been formed as rocks even earlier. It is clear from the minerals present that some phases involved crust being moved downwards to considerable depths – several tens of kilometres below the surface – although before the next episode (described below) the rocks had been moved back upwards and were exposed at the surface.
Surface modification of the Lewisian during the Tertiary and the Ice Age has carved it into typical ‘knock-and-lochan’ topography, in which the land surface consists of hillocks of exposed rock tens to hundreds of metres across (called knocks, from the Gaelic cnoc, a small, rocky hill), separated by water and bog-filled hollows (lochans) which often pick out folds and linear fractures in the bedrock (Fig. 23 (#ulink_e58116da-0136-51ae-aa28-cb36de3d86d0)). This wild knock-and-lochan landscape was once thought to represent the first formed surface of the Earth, but it is now realised that the surface shapes of the landscape are very much younger, and that the metamorphic alterations and movements, although very old, were preceded by even earlier episodes.
FIG 22. The distribution of the Pre-, Syn- and Post-Caledonian rocks in Scotland.
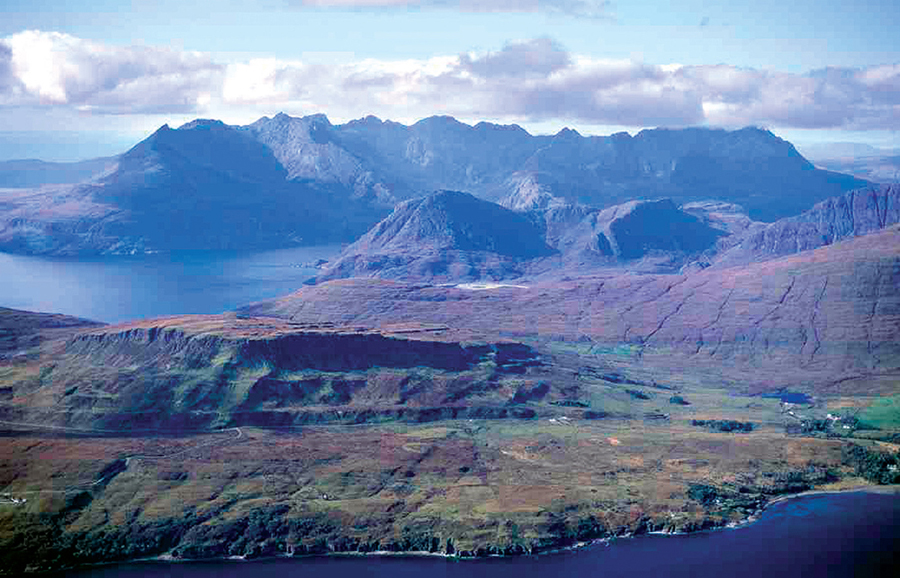
FIG 23. Aerial oblique view of Suilven (731 m), carved from Neoproterozoic Torridonian Sandstones resting unconformably on the knock-and-lochan topography of the Lewisian Complex. (© Adrian Warren/lastrefuge.co.uk)
Episode 2: formation of the Torridonian Sandstones
Mountains and slopes made of uniform but well-layered successions of Torridonian Sandstones, often tens to hundreds of metres thick, provide some highly characteristic elements of the Hebridean terrane (Fig. 23 (#ulink_e58116da-0136-51ae-aa28-cb36de3d86d0)). The layers are generally rather flat-lying, except in the folded and faulted bedrock of the Moine Thrust Zone where the Torridonian has been deformed along the eastern terrane boundary. Careful examination of the layering shows that it generally reflects episodes in the life of Torridonian rivers, which occasionally flooded and deposited sandy or gravelly river bars, often with muddy tops that have weathered to pick out the layers . Although much of the Torridonian was deposited by rivers, some of it accumulated in lakes or in the sea.
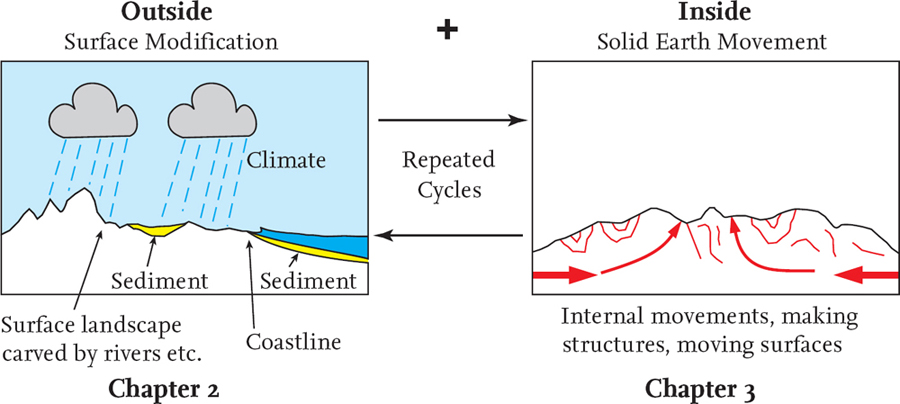
At least two different episodes of deposition are represented in the Torridonian Sandstones, and these have been dated, using radiometric methods, as Mesoproterozoic and Neoproterozoic (1.2 and 1.0 – 0.95 billion years ago respectively: Fig. 21 (#ulink_5ef00752-9d7a-5a35-83e6-cb77e10a1de8)). These two episodes left thick successions of sediment in the crustal record: up to 2 km in the Mesoproterozoic and up to 5 km in the Neoproterozoic. Thicknesses as great as these imply the downward movement of certain areas (basins) of the Earth’s surface close to areas where erosion due to upward movement was producing large quantities of sediment. In other words, although the Torridonian Sandstones are the result of modification by surface processes, these processes must have been linked to important vertical movements of the crust, due to forces acting within the Earth.
FIG 24. Cross-section through the Ord window of Southern Skye, showing the folded and fractured structure of the bedrock below the Moine Thrust.
The contact between the flat-lying layering of the Torridonian and the underlying Lewisian Complex is an unconformity that formed when the Torridonian sediments were deposited onto topography of valleys and hills (often hundreds of metres in relief) that had been carved in the Lewisian Complex. This unconformity, although preserving local Proterozoic hills and valleys, is relatively flat-lying overall, showing that widespread vertical movements – rather than significant folding or tilting – must have been involved.
The western and eastern margins of the present-day Atlantic Ocean were close to one another within a ‘super’-continent when the Torridonian sediments were accumulating. It seems likely that much of the sediment was derived from upland areas whose crust is now in Greenland or eastern Canada.
Episode 3: Cambrian and Ordovician sedimentation
A rather uniform succession of sediments of Cambrian and Ordovician age occurs more or less continuously along a strip from Skye, in the south, to the north coast of the Scottish mainland (Figs 19 (#ulink_14158c9a-c802-5caf-a8ea-fcd8d794c594), 20 (#ulink_92e7c4dd-e904-5c91-a5eb-a77514394804), 22 (#ulink_974e4b5e-a91a-5d0c-be9f-f997dba62da2): our ‘Greenland edge’). This succession was deposited unconformably on the eroded rocks of the Lewisian Complex and the Torridonian Sandstones. These Cambrian and Ordovician sediments only occur in the Hebridean terrane, and their usually gentle tilt is evidence of the lack of later movements, although they have been folded and fractured in the Moine Thrust Zone along the terrane’s edge (Fig. 24 (#ulink_19f49dad-6bb2-521a-9811-4a6da08ecd8c)).
Where most fully developed, this sedimentary succession is about 1 km in thickness and consists of a lower unit of quartzites (up to 100 m thick) that forms a greyish-white cap on some mountains and weathers to produce distinctive angular scree and boulder fields. Above this is a thin unit of mudstones, fractured and folded by subsequent movements on the Moine Thrust, overlain by a thick succession of limestones which, according to the fossil evidence contained within them, span the time interval from early Cambrian to early Ordovician (Fig. 21 (#ulink_5ef00752-9d7a-5a35-83e6-cb77e10a1de8)). In the present-day landscape, these limestones often produce swallow holes and caves formed by solution of the limestone’s fracture joints, as well as unusually lush grass wherever there is significant soil development.
The whole of this succession appears to have formed on the edge of a sea, and the occurrence of similar sediments on both sides of the present-day North Atlantic, a much more recent feature of the Earth’s surface, suggests a widespread uniformity in the coastal environments at this time. It is believed that these deposits formed due to surface modification involving global sea-level change, with no clear evidence of local movements due to processes deeper within the Earth.
CALEDONIAN MOUNTAIN-BUILDING EPISODES
The Latin adjective Caledonian is widely used to indicate Scottish-ness, and is used in geology for the important phase of mountain building that dominated earth movements and surface modification in Scotland between Ordovician and Devonian times. Evidence of similar movements and modifications during the same time periods is found along the east coast of the USA, Canada and Greenland, and through Ireland, Norway, Sweden and Spitsbergen. The terranes now recognised in Scotland have been mentioned above and shown in Figure 20 (#ulink_92e7c4dd-e904-5c91-a5eb-a77514394804). Distinct areas of continental crust, some thousands of kilometres across, others much smaller, rode on plates (Chapter 3 (#u5ec5bf09-5acf-58e3-8f03-7029db4715a5)) that moved independently and came together at different stages over Ordovician, Silurian and Devonian times to create the final assemblage of crustal fragments now present in Scotland. The main crustal fragments and their plates and intervening oceans are tracked in summary in Figure 25 (#ulink_b6cf889e-f4b9-5df3-9253-ea72e9fe5903).
Episode 4: making the core of the Caledonian mountains
The core of the Caledonian mountain belt is represented by the metamorphic bedrock that forms most of the Northern Highland and Grampian Highland terranes (Fig. 20 (#ulink_92e7c4dd-e904-5c91-a5eb-a77514394804)). The metamorphism of the originally largely sedimentary rocks occurred under the high pressures and temperatures that reflect their deep burial when compressive movements caused thickening of the crust and mountain uplift at the surface.
For many years a distinction has been drawn between the Moine and Dalradian supergroups in the mapping of the metamorphic core of the Caledonian mountain belt (Figs 19 (#ulink_14158c9a-c802-5caf-a8ea-fcd8d794c594) and 20 (#ulink_92e7c4dd-e904-5c91-a5eb-a77514394804)). The Moine Supergroup was named after a stretch of moorland on the north coast. It forms most of the Northern Highland terrane and may be present also in part of the Grampian Highland Terrane (Fig. 19 (#ulink_14158c9a-c802-5caf-a8ea-fcd8d794c594)). In contrast, the Dalradian Supergroup contains a greater variety of metamorphic rock types that have made it possible to trace distinctive subdivisions across most of the rest of the Grampian Highland terrane and even into Shetland. The name Dalradian has many historic roots and, in a geological sense it simply indicates association with the Scottish Highlands and parts of Ireland. There is general agreement that the original (pre-metamorphism) sediments of the Moine are older than those of the Dalradian, but the mapping of any boundary between them is still very arbitrary, and is not important in our review of landscapes across Scotland.
FIG 25. Diagram showing major plate-scale ocean closings and openings, with compressive events on the plate margins that generated events during the Caledonian and later Variscan mountain building. Ma (mega-annum) = million years ago.
The dominant bedrock of both these supergroups is metamorphic. In other words, the bedrock has been altered but not melted, during the growth of new minerals under the high temperatures and/or pressures generated by compressive movements and thickening of the crust. The original rocks of the Moine and Dalradian were mostly formed as sediments, mainly muds and sands but also occasionally lime-rich sediments. These sediments have now been transformed into schists (also called pelites; originally mudstones) and psammites (originally sandstones).
Knowledge of the age of the original rocks and the age of their alteration depends on sophisticated analysis of the decay of radioactive mineral components. The Moine Supergroup appears to have been deposited in the Neoproterozoic (about 1000 – 900 million years ago), so it was being formed at the same time as part of the Torridonian succession, although horizontal movements have brought them closer since they formed. Today, the Moine contains evidence of at least three different episodes of mineral alteration, the first around 850 million years ago (Knoydartian), the second 470 million years ago (Grampian; mid-Ordovician) and the last roughly 430 million years ago (Scandian; mid-Silurian), each resulting from phases of movement in the Earth’s crust where the rocks were moved, folded and fractured (Fig. 21 (#ulink_5ef00752-9d7a-5a35-83e6-cb77e10a1de8)). The Grampian and Scandian episodes are usefully distinguished as important phases in building the core of the Caledonian mountain belt. A further phase, the Acadian (mid-Devonian, 400 million years ago), is more clearly seen in other areas, showing that the movement pattern along the mountain belt involved many distinct continental fragments with different movement histories (Fig. 25 (#ulink_b6cf889e-f4b9-5df3-9253-ea72e9fe5903)). Much later, in the Mesozoic and Cenozoic, this belt was split by the plate divergence that formed the Atlantic Ocean, explaining why today there are other fragments of the Caledonian belt in Canada, Greenland and Scandinavia.
The Dalradian Supergroup was originally a succession of sediments more varied in type than the Moine. This has allowed the mapping of distinctive rock types across the country, revealing a complex pattern of folds (some upright, others over-folded) and fracture surfaces, themselves often folded after their original formation. These were formed by complex, multi-phase movements which occurred during a general convergence of the crust in a northwest/southeast direction. Radioactive dating indicates that much of this movement took place 470 million years ago, in the same Grampian episode that also deformed the Moine. It is estimated that the crustal rocks of the northern part of the Grampian Highland terrane were uplifted by some 25–35 km during this event, creating a major mountain range. Note that, despite such large amounts of uplift being indicated by research on the pressures that cause the metamorphism, mountains themselves never reach heights above sea level of this magnitude. The present height of Mount Everest is about 9 km, and this is thought to be some indication of the maximum height to which mountains can be lifted, given the powers of erosion that can be generated in present-day steep and high mountain belts. The mountains being measured in planets and moons may be bigger because of the different gravitational forces present.
Igneous intrusions were also formed during the Caledonian episodes, as heat from the compression produced molten magma that rose in the deforming crust, cooled and solidified, most commonly forming granites. These igneous volumes were emplaced both during and after the various phases of Caledonian movement. Where they have been exposed by erosion, they have given rise to differences in the material properties of the bedrock that have locally influenced the present-day landscapes.
The Great Glen Fault is one of the most obvious features of the landscape when Scotland is viewed from a satellite in space. Unlike the complex forms of the coastline and the river valleys, it represents a simple, straight or perhaps very slightly curved, vertical fracture cutting the crust (Figs 19 (#ulink_14158c9a-c802-5caf-a8ea-fcd8d794c594), 20 (#ulink_92e7c4dd-e904-5c91-a5eb-a77514394804), 22 (#ulink_974e4b5e-a91a-5d0c-be9f-f997dba62da2)). This major feature separating the Northern Highland and Grampian Highland terranes, and bisecting the Caledonian core, is now thought to have been part of a system of fractures that formed first in the Scandian phase (mid-Silurian, 430 million years ago) due to compressive continental movements that involved a strong enough oblique component to produce sliding parallel to the bedrock fabric of folds and faults generated by the general compression. A recent estimate of the amount of strike-slip sliding between Laurentia and Baltica (Fig. 25 (#ulink_b6cf889e-f4b9-5df3-9253-ea72e9fe5903)) during this phase is that it was about 1200 km, although this total movement was distributed between numerous faults. In the simple analysis of fault mechanics in Chapter 3 (#u5ec5bf09-5acf-58e3-8f03-7029db4715a5) (Fig. 17 (#ulink_aee633f4-0b1c-53bf-ad26-bfada4da029c)), a clear distinction was drawn between reverse faulting, resulting from convergence or compression, and strike-slip faulting, resulting from shearing. The present belief is that the Great Glen, and other similar faults, formed as a result of a combination of compression and shearing, sometimes referred to as oblique-slip, or transpression.
Episode 5: formation of the Lower Palaeozoic of the Southern Uplands terrane
Strongly folded, fractured and altered Ordovician and Silurian bedrock predominates in the Southern Uplands terrane. The commonest material is mudstone, often altered to slate. Altered sandstones are also common, with lesser amounts of altered limestone and volcanic material (Fig. 19 (#ulink_14158c9a-c802-5caf-a8ea-fcd8d794c594)). In the present landscapes, much of this material has been weathered and covered to some degree with Ice Age deposits, so good exposures of the sediments are rare and the hills of the Southern Uplands are generally more rounded and less rocky than those of the Highlands.
FIG 26. Sketch sections of an accretionary prism forming during subduction: (a–c) the development of thrusting (reverse faulting) within an accretionary prism; (d) age relations within the thrust stack. Thrust sheets get younger towards the southeast (i.e. 1 is older than 3) but, within each sheet, beds get younger towards the northwest. The beds are often very tightly folded and dip steeply.
It is thought that these sediments first formed as an accretionary prism, created when ocean crust in the southeast was subducted (see Chapter 3) beneath the deforming continent to the northwest, now represented by the Highlands. As subduction continued, the newly deposited sediments were folded and scraped up into a number of slices that were made of younger and younger ocean floor sediment as the movement continued (Fig. 26 (#ulink_441031df-1412-5973-85bc-d346458c101b)). How much of the Southern Uplands formed as one of these accretionary prisms is uncertain, but it is clear that the setting was marginal to the main Caledonian mountains that lay to the north. The oceanic crust was subducted along a line (locally called the Iapetus Suture: see Fig. 20 (#ulink_92e7c4dd-e904-5c91-a5eb-a77514394804)) that lay to the southeast of the Southern Uplands, roughly along the present Scotland–England border.
Episode 6: formation of the Lower Old Red Sandstone
Old Red Sandstone is the name commonly given to the red sandstones, mudstones and conglomerates that underlie rocks of Carboniferous age. The Old Red rests unconformably on older rocks in all of the Scottish terranes except the Hebridean, where it is absent (Figs 19 (#ulink_14158c9a-c802-5caf-a8ea-fcd8d794c594), 20 (#ulink_14158c9a-c802-5caf-a8ea-fcd8d794c594)). Successions of this bedrock have been classified as Lower, Middle and Upper Old Red Sandstone, depending on their fossil content and spatial relationships. Episode 6 concerns only the deposition of the Lower Old Red Sandstone.
Although fossil evidence for dating the Lower Old Red Sandstone is not common, the primitive fish and plant fossils that do occur indicate that it was deposited during the late Silurian and early Devonian, about 420 – 400 million years ago (Fig. 21 (#ulink_5ef00752-9d7a-5a35-83e6-cb77e10a1de8)). The weathering properties of these rocks are such that, in their present-day erosional landscapes, the conglomerates (with their associated lavas) have generally resisted erosion, tending to produce distinct ridges and steep slopes.
The processes of surface modification that deposited the Lower Old Red Sandstone took place largely on land, in rivers and lakes, with small amounts of sediment transported locally by the wind. Great thicknesses of lava are also important, particularly in the Midland Valley, Grampian Highlands and the Cheviot area of the Southern Uplands. The andesitic composition of these lavas suggests they were formed by internal Earth movements related to the plate subduction associated with Episode 5, and they are the earliest Scottish rocks to have yielded reliable measurements of their magnetism at the time of their formation. This information has been used to show that Scotland was located roughly 20 degrees south of the equator at this time, and it is believed that the Scottish terranes had moved into approximately their present-day positions, relative to one another, by the end of this episode (Fig. 25 (#ulink_b6cf889e-f4b9-5df3-9253-ea72e9fe5903)).
FIG 27.Geography of Scotland during deposition of the Lower Old Red Sandstone. (After Trewin 2002)
It seems likely that many of the late Silurian and early Devonian sediments and igneous rocks accumulated in distinct subsiding basins, separated by a series of northeast/southwest-trending uplifting areas that formed during the later phases of the Caledonian mountain building. Although much of the sediment in these basins was derived locally from these actively moving uplands, there is evidence that some of it was transported here by large rivers flowing from other areas of active movement in Scandinavia. The fact that the Lower Old Red sediments are predominantly non-marine in nature shows that most of the crustal surface of Scotland had been raised above sea level by this time (Fig. 27 (#ulink_c03c6115-1272-59b9-bcb6-0b85ac965b39)).
POST-CALEDONIAN EPISODES
Episode 7: formation of the middle to late Devonian, Carboniferous and Permian
It is convenient to group together as one episode the deposition of the Middle and Upper Old Red Sandstone (Devonian), the rocks of the Carboniferous and those of the Permian. The total time period represented by these units extends from about 395 to 290 million years ago, by which time Scotland had moved north to equatorial latitudes. The rocks of this episode consist largely of mudstones and sandstones, deposited by rivers in lakes, on coasts and in shallow seas. They vary considerably in age and extent, lying on the eroded top of the deformed Caledonian bedrock and often reaching thicknesses of many kilometres.
Although there is plenty of evidence of internal earth movements during this episode, their intensity and regional geography indicates a change from the strongly compressive regime associated with the Caledonian mountain building and the closing of the Iapetus Ocean (Episodes 4 to 6). By the mid-Devonian, extension had begun through much of Scotland, resulting in the formation of subsiding basins. The Middle Old Red Sandstone formed in a particularly large basin often referred to as the Orcadian Lake Basin (Fig. 28 (#ulink_97ce30e1-e360-557b-93ae-e0a8135abc77)). This extensional tectonic regime continued to characterise Scotland during much of the Carboniferous.
During the Devonian and Permian, sandy, wind-blown dune fields and evaporating groundwater conditions existed at times when local deserts developed under arid climatic conditions. The Carboniferous by contrast lacks evidence of such arid climates: river mouths were often deltaic, and the regular movement of river channels deposited distinctive cycles in the sedimentary succession, consisting of vertical changes in sediment type – most obviously between sheets of sandstone and mudstone. Limestones are also sometimes dominant where sources of sand and mud were absent. Coal-forming conditions developed repeatedly during the Carboniferous, particularly in parts of what is now the Midland Valley, and hydrocarbon-bearing mudstones were briefly but vigorously exploited west of Edinburgh. Both these had an important influence on economic and social development both locally and nationally. Carboniferous limestones, ironstones and certain sandstones have been economically important as well, at least in local terms.
FIG 28. Geography of Scotland during Middle Old Red Sandstone times. (After Trewin 2002)
Because of their economic significance, many of the Carboniferous deposits formed in this episode have been studied in great detail: tracing individual marker beds and attempting to date them by painstaking analysis of the fossil fauna and flora contained within them. This work has revealed that the Carboniferous sediments were deposited in large numbers of subsiding basins, usually only a few kilometres or tens of kilometres across (Fig. 29 (#ulink_33cd75d4-3832-57ea-8e98-9390fddd9ad7)). These basins formed due to vertical movements of the Earth’s crust along faults, the continued activity of which caused thickening and thinning of the sediments as they accumulated.
FIG 29. Geography of Scotland during early Carboniferous times. (After Trewin 2002)
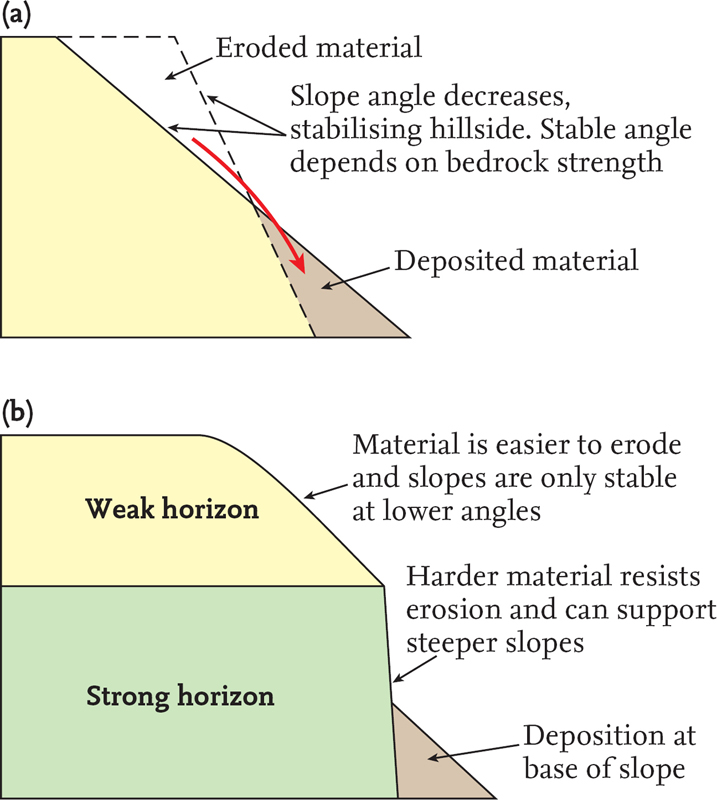
As well as sedimentation, this episode also involved considerable Carboniferous igneous activity, creating volcanoes and extensive lava fields and injecting large bodies of molten rock into the crust. This igneous bedrock has had a profound effect on the present-day landscape of the Midland Valley, and also on parts of the Southern Uplands. The weathering and erosion of the landscape has preferentially picked out the igneous bedrock because it is generally more resistant than the neighbouring sediments.
The Variscan mountain building (Fig. 25 (#ulink_b6cf889e-f4b9-5df3-9253-ea72e9fe5903)) is clearly represented in southwestern England and southern Ireland. In Scotland, it appears to be represented only by a change from Carboniferous deltaic sedimentation to undoubtedly freshwater or aeolian sedimentation in New Red Sandstone times, ushering in the Mesozoic.
FIG 30. Geography of Scotland and its surroundings during the Jurassic.
Episode 8: Mesozoic sedimentation
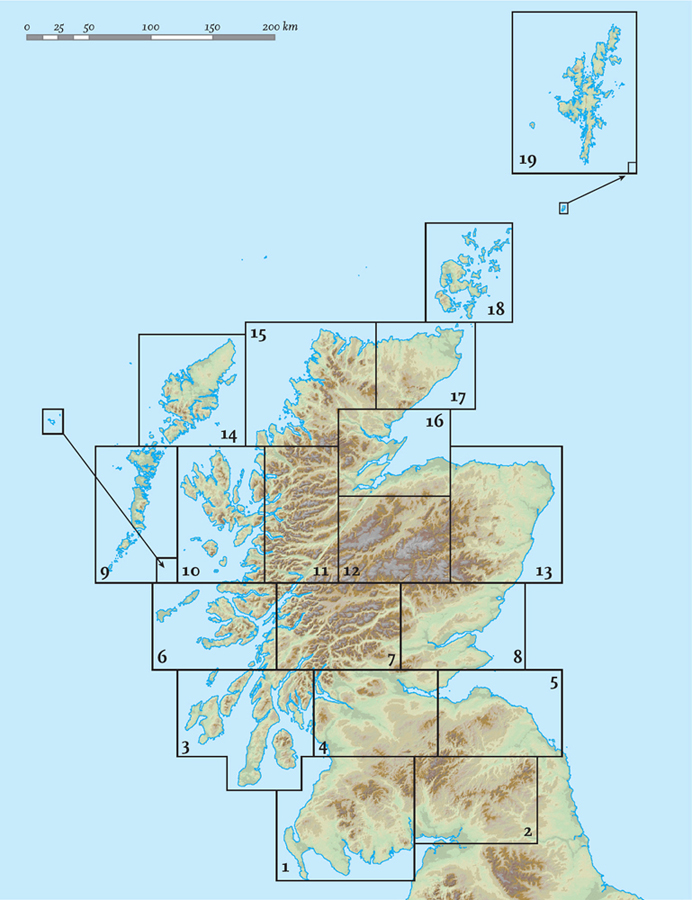
There are only relatively small volumes of Mesozoic sediment preserved as bedrock within the land area of modern-day Scotland, but large offshore areas of the sea bed are underlain by sediment of this age. The simple explanation for this is that the approximate map-shape of present-day Scotland was already becoming established by the beginning of the Mesozoic, resulting in extensive erosion of much of today’s landmass, followed by deposition in areas that are still offshore. Reconstructions of the geography of Jurassic times, say 175 million years ago, show an upland area roughly the shape of present-day eastern and northern Scotland. This area was surrounded by basins along the Hebridean and Atlantic margins to the west and by the North Sea to the east, into which sediments accumulated (Fig. 30 (#ulink_bfa30b4d-8430-59c2-86d2-9d5ebbe6a678)). Conditions varied between the areas of accumulation, but this broad pattern continued from the Triassic, through Jurassic and Cretaceous times.
The sandstones and mudstones of the Triassic are often red due to oxidisation of their iron minerals, indicating a dry, desert-like climate. Conditions at this time were influenced partly by the global climate, but also by the general pattern of plate movement which, by the end of the Triassic, saw Scotland at about 30 degrees north – equivalent to the present-day latitude of the Canary Islands.
In Jurassic times, where river deltas fed into shallow seas, a wide variety of rock types was deposited: mudstones, sandstones and limestones, along with rare ironstones and coals. Organic material – largely algal – formed locally in some of the muddy seas and was particularly abundant in the case of the Late Jurassic Kimmeridge Clay. This unit has been the main ‘source rock’ for the North Sea hydrocarbons that have had such a critical influence on the British economy over the last 40 years. Key points in the trapping and preservation of the hydrocarbons are the presence of sandstone with a suitable porosity, and earth movements that have subsequently stretched the crust, faulting it to seal the hydrocarbon reservoirs. Meanwhile, fault-related Jurassic landslide deposits are a spectacular feature of outcrops on one stretch of the east coast of the northern Highlands (see Areas 16 and 17), while in some parts of the Hebrides Jurassic sandstones have provided resistant bedrock that has influenced the development of the landscape.
Cretaceous bedrock is very rare on land in Scotland and is generally only preserved as isolated fragments in areas of Tertiary volcanism, where sheets of lava have protected the Cretaceous rocks from the erosion that has removed them elsewhere. Small amounts of sandstone and chalk (the Late Cretaceous algal limestone that is such a dominant feature of the landscape of southern England and northern France) are preserved in some of the volcanic centres, but do not tend to influence landscapes on a scale that can be considered in this book. On the other hand, the offshore record of the Late Cretaceous around Scotland is much more complete, and the lack of mud and sand (derived from the erosion of land-based bedrock) in these deposits suggests that Scotland had been eroded down to a largely flat landscape by this time.
Episode 9: Tertiary volcanism
About 60 million years ago, in the earliest Tertiary, a dramatic episode of igneous activity took place along the western seaboard of mainland Britain. The resulting bedrock has played a major role in forming features of the landscape of the western Hebridean, Northern Highland and Midland Valley terranes. Successions of lava flows formed volcanic lava fields tens to hundreds of metres thick in many areas of the Inner Hebrides and northern Ireland. Distinct fields have been dated around Eigg and Muck at 60.5 million years old, around Skye and Canna at 58 million years old and around Mull and Morvern at between 58.5 and 55 million years old. The layered (‘stepped’) landscapes eroded in the bedrock of these lava fields are striking, and are due primarily to differences in erosional resistance between the lower and upper parts of each lava flow.
FIG 31. General pattern of processes thought to underlie a typical igneous centre.
Even more striking are the centres of volcanic activity and igneous intrusion that developed in a scatter of localities shortly after the lava fields formed (Fig. 31 (#ulink_4df6b40a-4419-57b5-8cc0-51492f475684)). The coarsely crystalline intrusive rocks of these centres dominate the landscapes of their surroundings, because of the resistance of this material to erosion. The eroded remains of these ancient igneous centres now form the remarkable Cuillin and the Red Hills of Skye, the mountains of Rum, the hills of the Ardnamurchan peninsula and the main mountains of Mull and Arran, not to mention the islands of St Kilda and Ailsa Craig.
In wider geographical terms, these Tertiary igneous activities, along with the associated uplift and erosion, were responses to the tectonic plate divergence movements that created the Atlantic Ocean, with additional igneous input related to ‘hot-spot’ activity in east Greenland, Iceland, the Faroes, western Scotland and northern Ireland.
CHAPTER 5
Later Surface Modifications
THE PREVIOUS CHAPTER dealt with nine episodes recorded in the bedrock of Scotland. This chapter deals with three more recent episodes (Episodes 10–12; Fig. 21 (#ulink_5ef00752-9d7a-5a35-83e6-cb77e10a1de8)) which have modified the surface, removing bedrock and adding soft material to the surface blanket.
SURFACE-MODIFICATION EPISODES
Episode 10: Tertiary landscape erosion
Dating of the lavas extruded in Episode 9 suggests that Tertiary igneous activity in Scotland lasted for only about 5 million years and finished about 55 million years ago. This was followed by more than 50 million years of Tertiary and Quaternary landscape erosion (Fig. 21 (#ulink_5ef00752-9d7a-5a35-83e6-cb77e10a1de8)), during which time the main valleys of present-day Scotland increasingly approached their present shape and size.
Sedimentary bedrock of Tertiary age (Palaeogene and Neogene) is very largely absent on land in Scotland, even where volcanic and other igneous bedrock is present. This suggests that the crust below the present land area of Scotland was moving upwards and was subjected to net erosion during most of the Tertiary. Part of the evidence for this is the large thickness of Tertiary sandstones and mudstones that are found offshore to the east, north and west of Scotland, as shown by extensive oil exploration.
The valleys and mountains of Scotland, along with the lochs, sea lochs and offshore rock basins, have all been shaped by this erosion, principally by Tertiary rivers but also by more recent glacial ice (Episode 11). The present-day drainage pattern in Scotland (see Chapter 2) represents the latest phase in the evolution of this erosional system, and provides clues to the way it may have developed over the past 55 million years.
Episode 11: the Ice Age
During the nineteenth century, it became generally accepted that much of Britain had been subjected to glaciation by ice sheets and valley glaciers. Since then, this distinctive episode in the history of the British landscape has been referred to as the Ice Age, broadly equivalent to the Quaternary period of the internationally accepted series of time divisions (Fig. 21 (#ulink_5ef00752-9d7a-5a35-83e6-cb77e10a1de8)).
Over the last few years of geological research, one of the most far-reaching developments has been the establishment of the detailed record of fluctuating climate changes that have occurred during the Ice Age. A key step in this advance was the realisation that various indicators (often called proxies) of climate change can be measured at very high time resolution in successions of sediment or ice. The first of these successions to be tackled covered only the last few thousand years, but further work has now provided estimates of global temperature extending back several million years.
One of the best climate indicators has turned out to be variations in the ratios of oxygen isotopes (oxygen-16 versus oxygen-18), as recorded by microfossils that have been deposited over time on deep ocean floors. When alive, these organisms floated in the surface waters, where their skeletons incorporated the chemistry of the ocean water – including the relative amounts of oxygen-16 and oxygen-18. During cold climatic periods (glacials) water evaporating from the oceans may fall as snow on land and may be incorporated within ice sheets. Because oxygen-16 is lighter than oxygen-18 it evaporates more easily, so during cold periods the newly formed ice sheets tend to be rich in oxygen-16, relative to the oceans. The ratio of oxygen isotopes in the world’s oceans, as recorded by microfossils, can therefore be used to distinguish glacial and interglacial periods. Other useful indicators of ancient climate have come from measuring the chemical properties of ice cores, which preserve a record of the atmospheric oxygen composition, to complement the oceanic data from sediment cores.
Ratios of the isotopes of oxygen have turned out to provide one of the most important indicators of climate change, because they depend principally on ocean temperature and the amount of water locked up in the world’s ice sheets. There are, however, numerous other factors that can affect the ratios in ice and sediment cores, so interpretation of the data is rarely straightforward.
Figure 32 (#ulink_aec88710-8551-5019-b030-be6ddd3d7bd4) shows corrected oxygen isotope ratios as an indicator of temperature over the last 3.3 million years. The numbers on the vertical axis are expressed as δ18O values (pronounced ‘delta 18 O’), which compare the oxygen-18/oxygen-16 ratios in a given sample to those in an internationally accepted standard. The greater the proportion of heavy oxygen-18 in a sample the larger the δ18O value and, as described above, the lower the corresponding ocean temperature. For this reason, the vertical axis on Figure 32 (#ulink_aec88710-8551-5019-b030-be6ddd3d7bd4) is plotted with the numbers decreasing upwards, so that warmer temperatures are at the top of the figure and cooler ones at the bottom. The pattern shown in Figure 32 (#ulink_aec88710-8551-5019-b030-be6ddd3d7bd4) is of an overall cooling trend with, in detail, a remarkable series of over 100 warm and cool periods or oscillations. These alternations have been numbered, for ease of communication by the scientific community, with even numbers for the cold periods and odd numbers for the warm periods.
FIG 32.Oxygen isotope ratios track the more than 100 climate fluctuations over the last 3.3 million years. Warm episodes (red lines above the curve) alternate with cold episodes (blue lines below the curve). These have been used as the basis for numbering the global oxygen isotope stages, as shown.
Our next step involves looking in greater detail over roughly the last 400,000 years (Fig. 33 (#ulink_787309c8-3647-59bf-868b-c3329bbc0f2e)). Over this period, there has been a distinctive pattern of increasingly highly developed 100,000-year-long cold stages, separated by 10,000-year-long warmer stages. This temperature curve (also calculated from isotope ratios) is saw-toothed in shape, representing long periods of cooling followed by rapid warming events. The most recent of the four glacial episodes covered in this diagram (the Devensian) has left abundant fresh evidence on the landscapes of Scotland and obliterated most of the evidence of the earlier ones. In this important respect, the Scottish evidence differs strongly from that of southern England, where the much earlier Anglian glacial episode has left abundant evidence of ice as far south as London. This is because later glaciations, such as the Devensian, did not reach so far south. Not surprisingly, the older evidence in southern England is not as fresh as that of the younger glaciation in Scotland.
An even closer look at the last of these cold-to-warm changes (Fig. 34 (#ulink_645d655f-0818-5449-8f51-98fedb3f9682), black line) allows us to appreciate better the glaciation which has been responsible for much of the recent modification of Scottish landscapes. Starting with the Ipswichian interglacial, the Greenland curve shows fluctuations in the oxygen isotope ratios that were frequent and short-lived, though generally implying increasingly cool conditions. This part of the record is helping to define the Devensian glaciation and shows clearly the Late Glacial Maximum (LGM) at between about 30,000 and 20,000 years ago. Following this, the beginning of the Holocene warm period (about 10,000 years ago) is also clear.
FIG 33. Isotopic temperature of the atmosphere changing through the last 400,000 years, measured from ice cores taken from Vostok, Antarctica.
The link between oxygen isotopes, temperature and sea level becomes clear if we compare oxygen isotope ratios from the Greenland ice (Fig. 34 (#ulink_645d655f-0818-5449-8f51-98fedb3f9682), black line) with sea-level data from tropical reefs in Papua New Guinea (Fig. 34 (#ulink_645d655f-0818-5449-8f51-98fedb3f9682), red line). The data show how colder climates are generally associated with lower sea levels, reflecting the locking up of oxygen-16-rich water in land-based ice sheets during these colder times.
FIG 34. Black line: oxygen isotope ratios sampled from cores taken in the Greenland ice sheet. Red line: sea-level determinations from tropical reefs in Papua New Guinea.
At its maximum extent the Devensian ice sheet covered the whole of Scotland, including the western and northern islands. It also covered most of Wales and northern England and extended as far south as the Midlands, the Bristol Channel and the Wash. Maintaining a thickness of many hundreds of metres, it joined Norwegian ice on the Norwegian side of the northern North Sea (Figs 35 (#ulink_7e6b468b-fba8-5cf0-915e-b3347ed0d30e), 36 (#ulink_214ad505-b82c-5eec-9f25-23bc1af6c8e5)).
FIG 35. One estimate of the maximum extent of the Devensian ice sheet, with generalised ice-flow directions. At a later stage the Scottish and Norwegian ice became separated.
FIG 36. West-to-east generalised cross-section at the maximum extent of the Devensian ice sheet.
FIG 37. The larger rock basins are the result of erosion by Quaternary ice streams.
There is abundant local evidence in Scotland of the modification of valleys by glaciers and ice streams, which deepened and opened out the valley profiles, removing spurs and side ridges, to produce classic U-shaped glacial troughs. These troughs are very different from the V-shaped cross-sections and sinuous forms typical of river erosion (see Fig. 8 (#ulink_2429fe1f-257d-54c2-b31a-a5bdf6804749), Chapter 2 (#uc0e147ab-0db8-5cd3-a46c-c03cd0831740)). This modification work is likely to have taken place in every one of the Ice Age glacial stages that occurred in Scotland, and the same processes have also been responsible for the elongate rock basins now recognised in many offshore areas (Fig. 37 (#ulink_84f91e1e-e530-58b9-8d5f-abe42f81268b)).
FIG 38. Shrinking of the main Scottish ice sheet over the last 18,000 years.
Episode 12: since the Devensian Late Glacial Maximum
The period of rather more than 20,000 years since the Late Glacial Maximum represents one of the most recent phases of intense landscape evolution (Fig. 38 (#ulink_b8e5fada-2208-5fa5-b5ee-8243ebdd5187)). Because this was a period when ice cover was generally decreasing, local evidence is often preserved that would have been destroyed during a major phase of advancing ice. The last 10,000 years is often referred to as either the Holocene or the Flandrian Interglacial, the latter name emphasising that the ice may well return.
FIG 39. Oxygen isotope variation from (a) Greenland ice cores and (b) Northeast Atlantic sea-surface temperatures, both over the time period from 15,000 to 10,000 years BP (before present).
The record of climate change since the Late Glacial Maximum has been greatly illuminated by the same use of oxygen isotopes as described above for Episode 11. One important advantage in working on these recent times is that it is possible to seek additional, independent information for the ages of samples. Some of this dating may be based on comparison of plant remains, particularly pollen from cores extracted by drilling into lake beds or peat-rich wetlands. Other dates come from the analysis of radioactive carbon, whose rapid decay rate makes it a powerful tool in dating material that is so relatively young.
Although the dominant feature of global climate change over the past 20,000 years has been the general warming trend, detailed research has established a complex pattern of climatic fluctuations. In Scotland, the most important of these fluctuations is the Younger Dryas cold phase, also known as the Loch Lomond Stadial (Fig. 39 (#ulink_fb953f5d-69f7-5726-b236-2e0f344fd41f)). During this time, between about 13,000 and 11,500 years ago, the generally retreating ice re-advanced to form an icecap covering much of the western Highlands (Fig. 38 (#ulink_b8e5fada-2208-5fa5-b5ee-8243ebdd5187), red line). The local effects of this Loch Lomond Advance are particularly clear within the area of western Scotland where moraines were pushed forward.
SEA-LEVEL CHANGE
In Areas with coastlines, some of the freshest features of the landscape have formed since the Late Glacial Maximum as a result of changes in sea level. Two different mechanisms have combined to produce these changes:
(1) Worldwide ocean-volume changes of the water occupying the world’s ocean basins. These have been the direct result of the locking-up or releasing of water from land-based ice sheets as they grow or shrink due to climate fluctuations. The water itself may also have expanded or contracted as its temperature changed. These worldwide processes are often grouped together as eustatic.
(2) Solid Earth local movements which have resulted in the local raising or lowering of the ground surface relative to the level of the sea. These movements were responses to changes in the local temperature or stress pattern within the Earth. Ice-sheet melting unloaded the crust of the Earth locally, resulting in uplift, while ice-sheet growth loaded the crust, resulting in subsidence. These effects are often referred to as isostatic adjustments of local sea level (see Chapters 2 and 3).
Some parts of the world, for example many tropical areas, have been free of ice since before the Late Glacial Maximum and so have avoided any solid Earth movements associated with loading and unloading by ice. Records of changing sea level from these areas can therefore be used to estimate worldwide (eustatic) changes in the volume of the world’s oceans since the Late Glacial Maximum. Figure 40 (#ulink_98c98f73-a241-5a85-9d85-77ecebb0d443) shows that eustatic sea level has risen by about 120 m over the past 18,000 years, beginning with a slow, steady rise until about 12,000 years ago, followed by a rapid increase until about 6,000 years ago, and then another slow, steady phase up to the present day.
Curves of local sea-level change for any area can be estimated (relative to the present) by recognising and dating various features that indicate elevations in ancient coastal profiles. These features, preserved in the rocks either above or below the present sea level, include former erosional cliff lines, wave-cut platforms and ancient tidal, estuarine or freshwater deposits. The similarity or otherwise of such curves to the eustatic curve (Fig. 40 (#ulink_98c98f73-a241-5a85-9d85-77ecebb0d443)) depends on whether the areas in question have been subjected to any localised solid Earth movements, such as ice loading or unloading.
Two examples of British sea-level curves, relative to the present, illustrate how the local uplift and subsidence history varies for different coastal areas around Britain. In the Thames Estuary, local evidence shows that a rise of some 40 m has taken place through time over the last 10,000 years, at first very rapidly but then more slowly between about 6,000 years ago and the present (Fig. 41 (#ulink_98352187-f11b-538f-90c7-d1eb7b85a983), red circles). Modelling of the processes involved, incorporating estimates of eustatic (global) sea-level change and local solid Earth movements, gives a fairly good match to the observational data (Fig. 41 (#ulink_98352187-f11b-538f-90c7-d1eb7b85a983), black line).
FIG 40. Generalised change of worldwide (eustatic) sea level over the past 18,000 years. (After Van Andel 1994, Fig. 4.11)
FIG 41.Relative sea-level curve for the Thames Estuary.